
News + Media
"Using Land To Mitigate Climate Change: Hitting the Target, Recognizing the Trade-offs". John Reilly presents at the Cornell Institute for the Social Sciences.

Alli Gold Roberts
MIT Joint Program on the Science and Policy of Global Change
Yesterday, the United Nations Conference on Trade and Development released the 2013 Trade and Environment Review. The report encourages policy makers to “wake up before it is too late” and suggests a series of technologies, practices and policies to make agriculture more sustainable.
The report included contributions from more than 60 international experts, including MIT Joint Program on Global Change Research Scientist Kenneth Strzepek.
Strzepek and his colleague Brent Boehlert of Industrial Economic, Inc. of Cambridge wrote a commentary on the future threats to water availability for agriculture. Their research shows that by 2050 population growth, increasing water use, extreme weather and rising temperatures will significantly threaten water resources.
“Unfortunately, unless broad changes are made to the way environmental and water resources are governed, we predict conflicts over water for agriculture will increase significantly by the middle of the twenty-first century,” Strzepek says.
In their report, Strzepek and Boehlert recommend a series of water governance measures that can be used to better manage and allocate water for agriculture. Policy and management measures include assigning an economic value to water resources to encourage efficiency, switching to more sustainable and drought resistant crops, improving rain-fed irrigation infrastructure, and more equitably distributing water resources.
“There is no one-size fits all solution to this problem,” says Strzepek. “But it is important — and essential — that water planning efforts be coordinated and integrated across sectors to prepare for a changing climate in the future.”
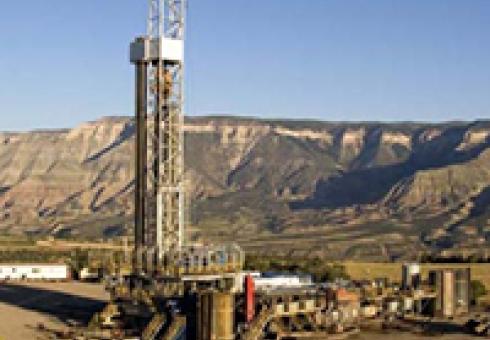
Environmental controls designed to prevent leaks of methane from newly drilled natural gas wells are effective, a study has found — but emissions from existing wells in production are much higher than previously believed.
The findings, reported today in the Proceedings of the National Academy of Sciences1, add to a burgeoning debate over the climate impact of replacing oil- and coal-fired power plants with those fuelled by natural gas. Significant leaks of heat-trapping methane from natural gas production sites would erase any climate advantage the fuel offers.
One concern is the potential release of methane during hydraulic fracturing, or 'fracking', which uses injections of high-pressure fluids to shatter rock and release trapped gas. Before production can commence, the well must be 'completed' by removal of the fracking fluids, which contain gas that can escape to the air.
To test the effectiveness of current controls, the researchers installed emissions-monitoring equipment at 27 wells during their completions in 2012 and 2013. Their results suggest that current controls reduce emissions in such wells by 99% compared to sites where the technology is not used, says lead author David Allen, an engineer at the University of Texas in Austin.
The researchers' estimate of annual emissions from wells undergoing completion, 18,000 tonnes per year, is also roughly 97% less than the estimate given in 2011 by the US Environmental Protection Agency (EPA).
Less encouraging was what the team discovered at 150 other well sites that were already producing natural gas. Such wells often use pneumatic controllers, which siphon off pressurized natural gas from the well and use it to operate production-related equipment. "As part of their normal operation, they emit methane into the atmosphere," Allen says.
His team's work suggests that emissions from pneumatic controllers and other equipment at production wells is between 57-67% higher than the current EPA estimate. However, the study also finds total methane emissions from all phases of natural gas production to be about 2.3 million tonnes per year, about 10% lower than the EPA estimate of 2.5 million tonnes…More.
Henry Jacoby, an economist and former director of the Joint Program on the Science and Policy of Global Change at Massachusetts Institute of Technology in Cambridge, agrees. "This is important work," he says, "but the great bulk of the problem is elsewhere, downstream in the natural gas system", including poorly capped oil and gas wells no longer in production.
Read the complete article here.
Reprinted by permission from Macmillan Publishers Ltd: Nature (doi:10.1038/nature.2013.13748), Copyright 2013.
Photo Credit: Steve Starr/Corbis

The MIT Energy Night is a celebration of the ingenuity, innovation, and imagination of MIT faculty, researchers, students, and alumni. Hosted annually at the MIT Museum and organized entirely by students, the MIT Energy Night features over 70 interactive poster presentations from every energy affiliated department at MIT as well as early stage start-ups based on MIT technologies. Presentation topics span conventional energies, renewable energies, energy storage, energy efficiency, and other areas.
This year’s event is poised to attract MIT students, faculty, energy investors, business leaders, researchers, and educators on October 18, 2013 from 5:00-8:30pm at the MIT Museum. Complimentary food and soft beverages will be provided. Alcoholic beverages can be purchased at a low cost.
The event is free and open to the general public. No registration is required.
Event URL: http://mitenergynight.org/
Stephanie Dutkiewicz presents at the MIT Future of the Oceans Symposium.

By Chris Knittel and John Parsons
Professor Robert Pindyck has a new working paper (CEEPR-WP-13-XXX) that has attracted a good share of attention since it steps into the highly charged debate on the reliability of research related to climate change. But in this case, the focus is on what we learn from one class of economic model, the so-called integrated assessment models (IAM). These models have been used to arrive at a “social cost of carbon” (SCC). For example, in 2010 a U.S. Government Interagency Working Group recommended a $21/t CO2 as the social cost of carbon to be employed by US agencies in conducting cost-benefit analyses of proposed rules and regulations. This figure was recently updated to $33/t. Professor Pindyck’s paper calls attention to the wide, wide range of uncertainty surrounding key inputs to IAM models, and to the paucity of reliable empirical data for narrowing the reasonable range of input choices. The paper then suggests profitable directions for reorienting future research and analysis.
Reflecting the highly charged nature of the U.S. political debate on climate change, Professor Pindyck’s paper has been seized on by opponents of action. In particular, certain blogs have cited his paper in support of their campaign against any action. Here is one example—link.
Interestingly, Professor Pindyck is an advocate of action on climate change, such as leveling a carbon tax. So his own view of the implications of his research are quite different than that of those who oppose any action. This post at the blog of the Natural Resources Defense Council includes more extensive comments by Professor Pindyck on the debate—link.
An alternative approach is to think about Professor Pindyck’s review as a guide for future research on the costs of climate change which is better focused to address the important uncertainties in a way that can better contribute to public discussion and analysis. CEEPR researcher Dr. John Parsons emphasizes this point in his blog post about Pindyck’s paper—link.
More...

Alli Gold Roberts
MIT Joint Program on the Science and Policy of Global Change
After four years of negotiations, delegates from more than 140 countries met last January to finalize the first global treaty to mitigate and prevent mercury pollution, the Minamata Convention. Now, as delegates reconvene in October to sign the treaty, an MIT researcher analyzes its potential effectiveness.
“This is the first global treaty to tackle this major public health and environmental pollutant,” says Noelle Selin, an assistant professor of engineering systems and atmospheric chemistry and a researcher with MIT’s Joint Program on the Science and Policy of Global Change. “While the treaty may not be perfect, it’s a step in the right direction.”
Selin, who participated in the January meeting and plans to attend the October signing, evaluated the impact of the treaty in a study published this week in Environmental Toxicology and Chemistry. Her analysis finds that, once fully implemented, the greatest environmental benefits of the treaty will be from avoided increases in emissions.
The treaty addresses almost all mercury sources worldwide. But the actions required differ depending on the source of emissions, which include chemical and industrial processes such as the burning of fossil fuels, cement production, waste incineration and gold mining. For example, one provision of the treaty requires countries to devise national action plans to help limit and control artisanal and small-scale gold mining, one of the largest sources of mercury pollution at about 37percent of emissions. Selin’s assessment will help policymakers focus their attention on where they can make the most impact in reducing this harmful pollutant.
Selin calculates that once the treaty is fully implemented emissions will decrease slightly or stay at about today’s levels. Because mercury takes decades to centuries to cycle through the environment, it will take a while before changes come into effect on a global scale. That explains why Selin’s projections through 2050 show only a small decrease in environmental mercury levels, relative to business as usual, about 1-2 percent a year.
“Since mercury remains in the environment long after it is released, any decrease in mercury emissions will be slow to affect global mercury levels. This means that actions, or inactions, today will ultimately influence global levels long into the future,” Selin says, stressing the significance of the treaty’s progress, however limited.
“Without policy measures, mercury emissions are likely to increase dramatically and preventing these emissions today will benefit the environment in the long term. It’s clear that the Minamata Convention will help countries prevent future emissions,” Selin says. “But we shouldn’t expect an immediate change in mercury pollution levels.”
Selin also notes that because the immediate drops in mercury levels over the next few decades are expected to be minor, “such a small decrease is less than we can confidently quantify using existing methods.”
The treaty, however, does include provisions to enhance monitoring capabilities. Selin makes several suggestions in her analysis of how to best make these enhancements. For example, she encourages different measurement techniques for organic and inorganic forms of mercury since they behave in unique ways in the global environment. In addition, because much of the benefit of the treaty will involve avoided emissions, comparison between models that project future emissions will be critical.
“There are major gaps in researchers’ ability to measure mercury pollution,” Selin says. “The Minamata Convention works to address these gaps. I look forward to seeing increased monitoring and research as the treaty is implemented around the globe. It’s a strong step, but must be just the first of many.”
Read more:
News Release: Strategies to Reduce Mercury Revealed Ahead of International Talks
Recent Event: Students witness science policy in action
Jennifer Chu, MIT News Office
Researchers from MIT’s Laboratory for Aviation and the Environment have come out with some sobering new data on air pollution’s impact on Americans’ health.
The group tracked ground-level emissions from sources such as industrial smokestacks, vehicle tailpipes, marine and rail operations, and commercial and residential heating throughout the United States, and found that such air pollution causes about 200,000 early deaths each year. Emissions from road transportation are the most significant contributor, causing 53,000 premature deaths, followed closely by power generation, with 52,000.
In a state-by-state analysis, the researchers found that California suffers the worst health impacts from air pollution, with about 21,000 early deaths annually, mostly attributed to road transportation and to commercial and residential emissions from heating and cooking.
The researchers also mapped local emissions in 5,695 U.S. cities, finding the highest emissions-related mortality rate in Baltimore, where 130 out of every 100,000 residents likely die in a given year due to long-term exposure to air pollution.
“In the past five to 10 years, the evidence linking air-pollution exposure to risk of early death has really solidified and gained scientific and political traction,” says Steven Barrett, an assistant professor of aeronautics and astronautics at MIT. “There’s a realization that air pollution is a major problem in any city, and there’s a desire to do something about it.”
Barrett and his colleagues have published their results in the journal Atmospheric Environment.
Data divided
Barrett says that a person who dies from an air pollution-related cause typically dies about a decade earlier than he or she otherwise might have. To determine the number of early deaths from air pollution, the team first obtained emissions data from the Environmental Protection Agency’s National Emissions Inventory, a catalog of emissions sources nationwide. The researchers collected data from the year 2005, the most recent data available at the time of the study.
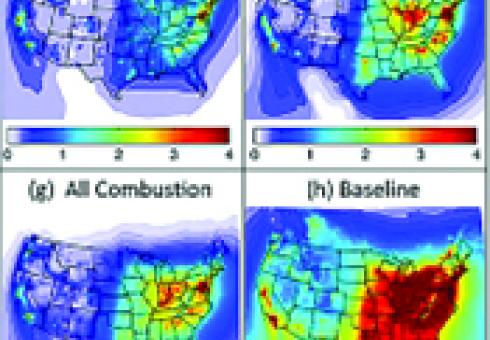
They then divided the data into six emissions sectors: electric power generation; industry; commercial and residential sources; road transportation; marine transportation; and rail transportation. Barrett’s team fed the emissions data from all six sources into an air-quality simulation of the impact of emissions on particles and gases in the atmosphere.
To see where emissions had the greatest impact, they removed each sector of interest from the simulation and observed the difference in pollutant concentrations. The team then overlaid the resulting pollutant data on population-density maps of the United States to observe which populations were most exposed to pollution from each source.
Health impacts sector by sector
The greatest number of emissions-related premature deaths came from road transportation, with 53,000 early deaths per year attributed to exhaust from the tailpipes of cars and trucks.
“It was surprising to me just how significant road transportation was,” Barrett observes, “especially when you imagine [that] coal-fired power stations are burning relatively dirty fuel.”
One explanation may be that vehicles tend to travel in populated areas, increasing large populations’ pollution exposure, whereas power plants are generally located far from most populations and their emissions are deposited at a higher altitude.
Pollution from electricity generation still accounted for 52,000 premature deaths annually. The largest impact was seen in the east-central United States and in the Midwest: Eastern power plants tend to use coal with higher sulfur content than Western plants.
Unsurprisingly, most premature deaths due to commercial and residential pollution sources, such as heating and cooking emissions, occurred in densely populated regions along the East and West coasts. Pollution from industrial activities was highest in the Midwest, roughly between Chicago and Detroit, as well as around Philadelphia, Atlanta and Los Angeles. Industrial emissions also peaked along the Gulf Coast region, possibly due to the proximity of the largest oil refineries in the United States.
Southern California saw the largest health impact from marine-derived pollution, such as from shipping and port activities, with 3,500 related early deaths. Emissions-related deaths from rail activities were comparatively slight, and spread uniformly across the east-central part of the country and the Midwest.
By Genevieve Wanucha
At “Debating the Future of Solar Geoengineering,” a debate hosted last week by the MIT Joint Program on the Science and Policy of Global Change, four leading thinkers in geoengineering laid out their perspectives on doctoring our atmosphere to prevent climate emergency. The evening featured Stephen Gardiner of the University of Washington, David Keith of Harvard University, Alan Robock of Rutgers University, and Daniel Schrag of Harvard University. Oliver Morton from The Economist ran the show as a deft and witty moderator.

The debate focused on the easiest, fastest, and cheapest geoengineering option on the table: solar radiation management. This technique would involve the intentional injection of sulfate aerosols into the Earth’s upper atmosphere, the stratosphere. These aerosols, the same particles released by volcanic eruptions, would reflect sunlight away from Earth, cool the planet, and, in theory, stabilize climate.
While climate modeling shows that solar radiation management would reduce risks for some people alive today, there are a number of reasons why this technique might be a bad idea, Alan Robock said. Pumping particles into the stratosphere could shift rainfall patterns and chew up the ozone layer, thus tinkering with the amount of water and UV light reaching human and ecological systems. “We are going to put the entire fate of the only planet we know that can sustain life on this one technical intervention that may go wrong?” he challenged.
Robock’s stance is what David Keith soon called “the very common, intuitive, and healthy reaction that geoengineering is ‘nuts’ and we should just get on with cutting emissions.” But Keith and Dan Shrag systematically picked the argument apart as they made the case that, even in the most optimistic of scenarios, we may not be able to solve the climate problem by acting on greenhouse gas emissions alone. For them, geoengineering is a real option.
Humans are burning enough fossil fuels to put 36 billion tons of CO2 into the air every year. And because the gas stays in the atmosphere for incredibly long time periods, we’re already committed to global warming far into the future. “Climate is going to get a lot worse before it gets better,” said Shrag. “We have to push for emissions reductions, but the world is going to put a lot more CO2 in the atmosphere, and we better figure out what to do about it.”
The debate was more nuanced than a “to geoengineer or not-to-geoengineer’ type of thing. Solar radiation management, Keith and Gardiner agreed, would not be ethical in the absence of a simultaneous reduction in CO2 emissions. As computer simulations by University of Washington researchers indicate, if we were to inject aerosols for a time, while continuing to emit carbon dioxide as usual, a sudden cessation of the technique for any reason would be disastrous. The aerosols would quickly fall to natural levels, and the planet would rapidly warm at a pace far too fast for humans, ecosystems, and crops to adapt.
“So if, as a result of decisions to implement solar engineering to reduce risks now, we do less to cut emissions and emit more than we otherwise would, then we are morally responsible for passing risk on to future generations,” said Keith.
Caveats to geoengineering continued to roll in during the Q&A. The technique would likely end up a dangerous catch-22 in the real world, according to Kyle Armour, postdoc in the MIT Department of Earth, Atmospheric and Planetary Sciences: “The case can be made that the times we would be most likely to use solar radiation management, such as in a climate emergency, are precisely the times when it would be most dangerous to do so.” In essence, implementing geoengineering to tackle unforeseen environmental disaster would entail a rushed response to a climate system we don’t understand with uncertain technology.
The post-debate reception buzzed with the general feeling that the panelists lacked enough “fire in their bellies.” “Debate? What debate?” asked Jim Anderson, Professor of Atmospheric Chemistry at Harvard. “I was expecting Italian parliament fisticuffs,” said Sarvesh Garimella, a graduate student in the MIT Department of Earth, Atmospheric and Planetary Sciences. Perhaps this was because, as several MIT graduate students noted, the debaters never touched the most fundamental research needed to evaluate the viability of geoengineering: aerosol effects on clouds.
The thing is, aerosols in the stratosphere do reflect sunlight and exert a cooling effect on Earth. “But they have to go somewhere,” said MIT’s Dan Cziczo, Associate Professor of Atmospheric Chemistry, who studies how aerosols, clouds, and solar radiation interact in Earth’s atmosphere. “Particles fall down into the troposphere where they can have many other effects on cloud formation, which have not been sorted out. They could cancel out any cooling we achieve, cool more than we anticipate, or even create warming,” Cziczo said. Indeed, the most recent Intergovernmental Panel on Climate Change (IPCC) report lists aerosol effects on clouds as the largest uncertainly in the climate system. “I don’t understand why you would attempt to undo the highly certain warming effect of greenhouse gases with the thing we are the least certain about.” For Cziczo, this is a non-starter.
The panelists largely acknowledged that we don’t understand the technique’s potential effects well enough to geoengineer today, but they have no plans to give up. Keith notes that a non-binding international memorandum laying out principles of transparency and risk assessment is needed now. And of course, vastly expanded research programs. “Before we go full scale,” said Keith as the debate came to a close, “we have to broaden far beyond the small clique of today’s geoengineering thinkers, but that doesn’t have to take decades.”
Watch the video here.
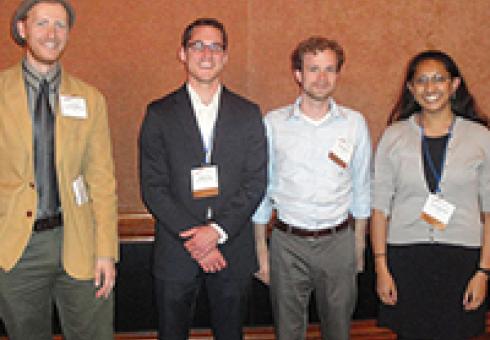
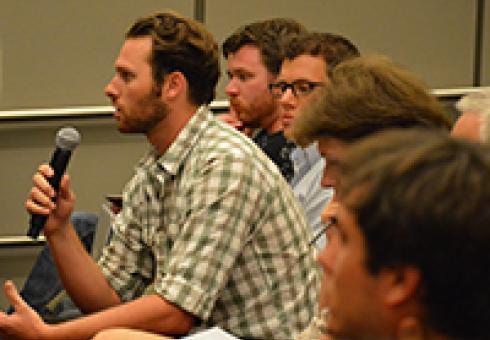
Four MIT students won first place in a competition by the U.S. Association of Energy Economics (USAEE) aimed at tackling today’s energy challenges and preparing solutions for policymakers and industry. The students, Ashwini Bharatkumar, Michael Craig, Daniel Cross-Call and Michael Davidson, competed against teams from other North American universities to develop a business model for a fictitious utility company in California facing uncertain electricity growth from a rise in electric vehicle charging.
“Overall, the case competition was a great opportunity to consider solutions to the very challenges that electric utilities are facing today,” says Bharatkumar.
With the goal of minimizing distribution system upgrade costs, the MIT team tested how well several business models or technology alternatives could address the utility company’s challenge. These included: implementing a real-time pricing and demand response program, using battery storage, using controlled charging, or some combination of the three.
The MIT students found that, instead of simply expanding the transmission and distribution network to accommodate the increased demand, the better course of action would be to install advanced metering infrastructure and implement controlled charging to shift the electric vehicle load to off-peak hours. They also recommended modifying the rate structure to include capacity – not just energy – costs. For example, grid users choosing to charge their vehicles during peak hours would incur an additional fee.
The team presented their recommendations at the annual USAEE and International Association for Energy Economics North American Conference in Anchorage, Alaska on July 29-31.
The MIT team’s presentation may be found here: http://www.usaee.org/usaee2013/submissions/Presentations/MIT_CaseComp_July29.ppt
Other presentations are available at: http://www.usaee.org/USAEE2013/program_concurrent.aspx

By Michael Davidson
Wind is China’s fastest growing renewable energy resource. In 2012, 13 gigawatts (GW) were added to the system, and incremental wind electricity production exceeded coal growth for the first time ever. In the same year, unused wind electricity hit record highs while wind not connected to the grid was roughly half the size of Germany’s fleet. China’s is perhaps the largest yet most inefficient wind power system in the world.
As a variable, diffuse and spatially segregated energy resource, wind has a number of disadvantages compared to centralized fossil stations. These unavoidable limitations are not unique to China, though they are magnified by its geography. In addition, as I outlined in a previous post, coal has uniquely shaped China’s power sector development and operation; these also play a role in limiting wind’s utilization. Eyeing ambitious 2020 renewable energy targets and beyond, policy-makers and grid operators are confronting a vexing decision: continue the status quo of rapidly expanding wind deployment while swallowing diminished capacity factors, or focus more on greater integration through targeted reforms.

Getting the Power to Market
Unlike other countries with varying political support for renewable energy, wind in China enjoys a privileged status. A well-funded feed-in-tariff (FIT) and other government support since 2006 encouraged an annual doubling of wind capacity for four consecutive years, followed by 10-15 GW additions thereafter. Wind projects are typically far from city and industrial centers where electricity is needed, however, and transmission investments to connect to the grid did not keep up pace. This remarkable gap left turbines – as many as a third of them in 2010 – languishing unconnected, unable to sell their electricity (see graph).

From Brazil to Germany, grid connection delays – primarily transformer and line right-of-way siting, permitting and construction – have occurred where there is rapid wind power development. China, however, had until mid-2011 a unique policy that exacerbated the wind-grid mismatch: all projects smaller than 50 MW could be approved directly by local governments, bypassing more rigorous feasibility analyses, in particular, related to grid access. The delay of central government reimbursement to overburdened local grids for construction may also be responsible. The level of non-grid connected capacity is hovering around 15 GW as of the end of 2012.
If you are a wind farm owner and have successfully connected to the grid, you might still face hurdles when trying to transmit your power to load centers. Grid operators make decisions a day ahead on which thermal plants to turn on, so if wind is significantly higher than forecasted 24 hours before, the difference may be curtailed (or “spilled”) to maintain grid stability. If wind is at the end of a congested transmission line, the grid operator may also have to curtail, as happens in ERCOT (Texas’ grid) and northwest China. Finally, to manage hourly variation, grid operators will accept wind as much as they can ramp up and down other generators to maintain supply and demand balance. The thermodynamics of fossil fuel plants place limits on this flexibility.
As with grid connection, China’s curtailment problems are much more severe than for its peers (see graph). The latest provincial figures, for 2011, pegged this at between 10~20%, and reports on 2012 show this skyrocketing to as high as 50% in some regions. By comparison, ERCOT peaked at 17% in 2009 and was 3.7% last year. This difference is largely, though not exclusively, attributable to two factors: China’s mix is coal-heavy which is more sluggish when changing output than, for example, natural gas. As I described before, the increased size of coal plants makes this effect more pronounced.

Secondly, since the Small Plant Closure Program began in 2006, new coal plants built to replace the aging fleet were preferentially designed as combined heat and power (CHP) to provide residential heating and industrial inputs where available, with the northeast seeing the highest penetration. Keeping homes warm during winter nights when wind blows the strongest effectively raises the minimum output on coal plants and reduces the space for wind. Following particularly high winter curtailment in 2012, China’s central planning agency, the National Development and Reform Commission (NDRC), began encouraging projects to divert excess wind to electric water heaters and displace some fraction of coal CHP. Given the capital investments required and the losses in conversion from electricity to heat, it is not clear how economical these pilots will be.
The Politics of Power
Besides the inflexibilities in the power grid described above, several idiosyncrasies of China’s power sector governance likely have a hand in spilled wind. A product of the partial deregulation that occurred between 1997 and 2002 was the establishment of “generation quotas” for coal plants: minimum annual generation outputs fixed by province loosely to recover costs and ensure a profit. Since China no longer has vertically integrated utilities, these are not true “cost-of-service” arrangements. There may be messy politics if wind cuts into the quotas of existing plants.
On top of this, decisions to turn on, up, down or off generators on the grid (collectively referred to as “dispatch”) are fragmented by region, province and locality (read here and here for excellent primers). To bring order to these competing demands, dispatch is fairly rigid and a set of bilateral contracts between provinces have been institutionalized stipulating how much electricity can be transmitted across boundaries. The primary reason for creating a wide, interconnected grid is the ability to flexibly smooth out generation and load over a large number of units, but this kind of optimization is nigh impossible without centralization of dispatch and transmission.
Targeted reforms could help deal with these hurdles to accommodating more wind. In fact, the guiding document for power sector reform published in 2002 (State Council [2002] No. 5) lays out many of them: establish a wholesale market in each dispatch region to encourage competition in generation; open up inter-regional electricity markets; and allow for retail price competition and direct electricity contracts between producers and large consumers, among others. Former head of the National Energy Administration and key arbiter during the reform process, Zhang Guobao, vividly recounts the heated discussions [Chinese] that led to this compromise.
Ten years later, most of the challenges are well-known: separately regulated retail and wholesale prices, a semi-regulated coal sector, and political fragmentation. Recently, there may be renewed interest in tackling these remaining reform objectives. Electricity price reform was listed in a prominent State Council document on deepening economic reforms in May, and NDRC has taken steps to rectify the coal-electricity price irregularities. Still broader changes will require strong leadership.
Managing the Unpredictable
Record curtailment in 2012 prompted a strong central government backlash: a suite of reports, policy notices and pilots soon followed. These were targeted at better implementation of existing regulations (such as a mandate that grids give precedence to renewables over thermal plants), additional requirements on wind forecasting and automated turbine control, and compensation schemes of coal generators for ramping services. These policies and central government pressure to better accommodate renewables appear to have had an impact: all provinces except Hebei saw an increase in utilization hours in the first half of 2013 [Chinese].
Due to the unique mix of power plants and regulation in China, typical wind integration approaches such as increased transmission are important but not sufficient. China aims to generate at least 390 TWh of electricity from wind in 2020, which is roughly 5% of total production under business-as-usual, over twice in percentage terms of current levels. This will put additional stresses on the nation’s purse and power grid. How China chooses to face these conflicts and grow its wind sector – through a combination of more investment and targeted reforms – will have unavoidable implications for the long-term viability of wind energy in the country.
Read Parts 1 and 2 in the "Transforming China's Grid" series: "Obstacles on the Path to a National Carbon Trading System" and "Will Coal Remain King in China’s Energy Mix?"