News + Media
By Alli Gold Roberts
MIT Joint Program on the Science and Policy of Global Change
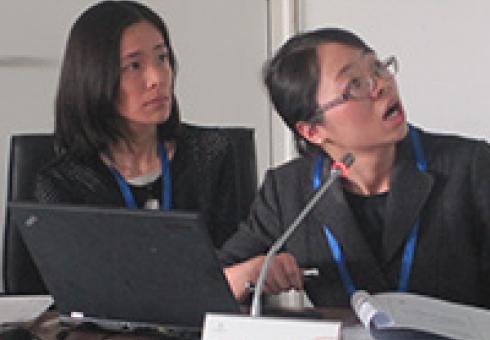
The MIT-Tsinghua China Energy and Climate Project and Emory University held a workshop on Thursday November 21st with researchers and government officials to discuss new research analyzing the impacts of China’s vehicle emissions policies. Researchers worked with policymakers to develop policy scenarios for a new integrated model that will analyze the emissions, air quality, economic, and public health impacts of policy proposals.
A joint team of researchers from Emory University, MIT, and Tsinghua University is carrying out the study. The project is supported by a grant from the Energy Foundation, which provides resources to institutions that most effectively leverage change in transitioning to a sustainable energy future. The Institute for Energy, Environment, and Economy at Tsinghua University hosted the workshop on their Tsinghua campus. At the meeting, policymakers, researchers, and other stakeholders engaged in a detailed, candid discussion of policy developments and scenario designs. The first meeting to launch this effort was held in March of 2013.
“This study will help policymakers understand the implications of taking more aggressive steps to control transportation emissions, particularly emissions from road vehicles, which have been outlined in the country’s new air pollution action plan,” says Dr. Valerie Karplus, who leads the MIT-Tsinghua China Energy and Climate Project. “Our framework allows us to quantify the costs and benefits of these measures within a single integrated framework.”
The meeting included representatives from the Chinese Ministry of Finance, Integrated Energy and Climate Policy Bureaus of the National Development and Reform Commission, Ministry of Industry and Information Technology, National Vehicle Emissions Control Center of the Ministry of Environment, and the Beijing Environmental Protection Bureau. The MIT, Tsinghua and Emory researchers used this workshop to communicate their results to policymakers and receive their input in designing policy scenarios for their model.
Using the China Regional Energy Model (C-REM), the group will model the impacts of China’s current and future transportation policies on the national economy and in the individual 30 provinces. The C-REM model was developed as part of the MIT-Tsinghua China Energy and Climate Project over the past two years. Recent modeling efforts include adding detail on the transportation sector and connecting the energy and economic data with a comprehensive inventory of China’s provincial emissions. The team used an atmospheric chemistry model to simulate air quality, including concentrations of ozone and particulate matter. Population-weighted concentrations are then used to simulate impacts on human health and economic activity.
The group plans to test three policy scenarios that will meet the needs of decision makers working on transport policy in China. They currently plan to test a no policy “business as usual” case for comparison, a current policies scenario, and an accelerated scenario that implements a more aggressive transport-focused pollution policy. The aggressive policy scenario focuses mainly on the role of tighter standards for fuel quality and vehicle tailpipe emissions.
“China’s leaders are placing ever greater emphasis on improving air quality and the environment,” says Eri Saikawa, assistant professor at Emory University and principal investigator on the project. “Policymakers are eager to identify specific measures that will help to achieve these goals.”
While building the transportation section of the model, researchers found that freight transport dominates energy use and emissions in most provinces, except the more urbanized regions. In addition, private vehicle ownership is rising rapidly and will have major implications for future emissions.
“China’s leaders have an opportunity to manage this growth by accelerating the adoption of low emissions vehicles nationwide,” says Karplus.
Over the coming months, the group will continue to improve the modeling framework and simulate the three policy scenarios. The final results will be shared with policymakers by the end of 2014.
The next meeting is planned for March of 2014.
Update 7:30pm, Saturday, November 23
Decisions have been adopted on the three major elements of COP19: Durban Platform, Loss and Damage, and institutional mechanisms for finance.
Update 4:11pm, Saturday, November 23
The decision of the Durban Platform was adopted and the plenary to finalize other COP decisions on finance and loss and damage will commence soon.
Two weeks at the UN climate negotiations in Warsaw (COP19) have passed, and talks continued well into Saturday. As I wrote earlier this week, this conference was an important step on the way to Paris in 2015, when an international treaty for action on climate change post-2020 will be sought. Much reporting has focused on the acrimony between developed and developing countries, largely based on outstanding issues of development assistance and compensation for climate damages that were held by some as preconditions for success. Into the late hours, unmet expectations from some developing countries pushed discussion on the prospective structure and timeline for the 2015 agreement into Saturday afternoon.
More...
John Reilly delivers a lecture during the Yale Climate and Energy Institute (YCEI) Conference, "Uncertainty in Climate Change: A Conversation with Climate Scientists and Economists".
By Vicki Ekstrom
Read the 2013 Energy and Climate Outlook
As international negotiators discuss global efforts to confront climate change at the 19th United Nation’s Conference of Parties (COP19), a group of MIT researchers suggest that the current regional efforts may not be enough to avoid the dangerous consequences of rising emissions.

“As our global population swells to more than 10 billion by the end of this century, climate change is one of the forces of global change that will shape how the world feeds, shelters, transports, and otherwise attends to this growing mass of people,” says John Reilly, co-director of the Joint Program on the Science and Policy of Global Change and an author of the 2013 Energy and Climate Outlook. “Our latest Outlook is a window into the future as we view it in 2013, but it is still in our power to change what we see by taking action.”
While much of the Outlook’s projections remain the same as in their 2012 Outlook – highlighting that large or developing countries will play a greater role in shaping our global challenges over time – shifting trends and new and updated data have led to subtle changes. One such trend is the growing use of natural gas and, to a lesser extent, renewable energy. Policies such as the European Union’s Emissions Trading System (and assuming Europe continues on its announced post 2020 policies)helped bring about some of these changes; cutting Europe’s coal generation in 2050 by almost half compared to the last Outlook. The U.S. is also expected to generate 35 percent more renewable energy and 15 percent more natural gas by 2050 compared to the 2012 Outlook.
Taking into account these resource and policy changes, the researchers project global natural gas consumption by 2050 to be 8 percent higher than their 2012 estimates, with China’s consumption alone more than tripling. They also project global consumption of renewable sources by 2050 to be 13 percent higher, while coal and oil usage will sink slightly (3 percent).
Changes in the global energy mix are partly responsible for a 12 percent dip in the projected CO2 emissions by the end of the century. Yet, these emissions are still projected to be 95 percent higher than in 2010. Even with cumulative emissions sinking slightly, the Outlook projects the world will warm by 3 to 6°C by 2100 compared to 2000, with the median forecast at 3.8°C.
“With natural gas becoming more and more important to the global energy mix each year, and recent policy efforts spurring an increased use of renewables, we do believe there will be slightly fewer emissions than we originally forecasted,” says Sergey Paltsev, an author of the study and the assistant director for economic research at the Joint Program on Global Change. “But, while growing at a slightly lesser rate, emissions are still increasing, and if they continue to grow we might experience very harmful consequences.”
Building on the models used for their 2012 Outlook, the researchers identify the hottest and coldest regions and the range of uncertainty. They find that generally the polar areas display the most warming, with Northern Canada and Siberia warming between 6 and 12°C by 2100. Meanwhile, North America, Europe and Asia can expect temperatures to warm by as much as 4 to 8°C, and Africa, Australia and South America can expect temperature increases between 3 and 7°C. The researchers also warn there could be very damaging consequences from an increase in extreme precipitation events, such as floods. Their analysis shows most land areas will become wetter, while over the ocean and Tropics a few regions could become drier.
“Taking into account the vast uncertainty in climate projections, even in our most optimistic scenario we see that these changes will surely impact food and water resources, among other changes,” says Erwan Monier, an author of the study and a scientist at the Joint Program on Global Change.
As in the 2012 Outlook, the researchers emphasize that further cuts in developed countries would be useful. But only 13 percent of emissions are expected to come from these countries by 2100, meaning their efforts will have less of an impact over time as the share of emissions from other nations increases. Emissions from countries outside the developed world could grow by almost 150 percent by the end of the century.
Reilly, Paltsev and nine others based their projections on the United Nations' estimate that the world's population will grow to more than 10 billion by 2100. Using their computer modeling system to project how this growth would affect our energy and climate, they then incorporated pledges made by G20 nations at international meetings in Copenhagen in 2009 and Cancun in 2010 to cap emissions by 2020.
“As difficult as the progress made in Copenhagen and Cancun was to achieve, far more effort is needed to limit greenhouse gas concentrations to levels that avoid dangerous climatic consequences,” the authors write, stressing the importance of the ongoing international talks.
John Reilly presents at the League of Women Voters event on the role of the free market in solving the climate crisis.
We are heading into the second week of UN climate negotiations in Warsaw (refered to as COP 19), where 194 countries are busy laying the groundwork for an international treaty hopefully to be concluded by 2015. Created under the auspices of the UN Framework Convention on Climate Change (UNFCCC), this would be a first-of-its-kind agreement to guide global action from 2020. A casual observer may recall similar rhetoric leading up to the Copenhagen climate summit that produced a three-page “accord” rather than the permanent treaty solution as promised. However, in Warsaw, several issues are on the table (and several others, crucially, off) that demonstrate the hardiness and progressive (though often glacial) march of multi-lateral environmental governance.
Detractors of the UN climate regime will question the effectiveness of a 20+ year process that functions (or not) on the consensus between 194 members who range from climate problems to climate victims. After all, the only legally-binding outcome to date – the Kyoto Protocol – did little to slow down emissions over its first commitment period (2008-2012) and even fewer have signed up for targets in the next period. Last week, Japan scaled back its 2020 targets, following on the heels of the Australian coalition government's announcement of intention to repeal their carbon tax, drawing the ire of virtually everyone.
At the same time, scholars have noted that outside the UNFCCC process there have been countless bi-lateral and multi-lateral initiatives such as between the US and China and the G20, and a proliferation of platforms collecting commitments from states/provinces, cities and corporations. These actors are arguably more important than many nation-states in terms of mitigation potential, yet do not have a seat at the table. UN Secretary-General Ban Ki-moon is hosting a climate summit for world leaders next year to push for greater commitments. Businesses, cities and others are expressly invited.
Nevertheless, I argue that one should watch carefully this treaty process, because despite the outward lack of progress, the UNFCCC will still help stimulate both pre-2020 and post-2020 actions on climate change. Further, it has significant implications for how the global community chooses to address other environmental issues and cross-cutting challenges such as poverty eradication.
First, the UN has exercised its convening power to leverage commitments from all major emitters, and can do this again. High expectations in advance of the Copenhagen climate summit in 2009 led the BASIC countries (Brazil, South Africa, India and China) to depart from tradition and announce significant 2020 targets. They were not obligated to do so by the Convention, which created a “firewall” between industrialized and developing countries, only the former having the requirement to mitigate. Despite the failure to achieve consensus at Copenhagen these commitments stuck, and were enshrined in the official outcome the following year. The US, not a signatory to the Kyoto Protocol, joined in committing to reductions.
Second, the legitimacy of the UNFCCC as the only forum dedicated to climate with official blessing from every country cannot be understated. Addressing climate change, whose costs are concentrated in a handful of industries in every country but whose benefits are diffuse and highly variable, is a classic free-rider problem, whereby one non-cooperative party enjoys the positive externalities of others’ sacrifices. A common front means greater international pressure on parties to fulfill their commitments.
Third, the UNFCCC has historically been a precedent-setting institution. Market mechanisms such as carbon offset trading were enshrined in the Kyoto Protocol, and as a result they have become a favored policy approach for domestic programs around the world. In the last several years, worries of feasibility of getting consensus have been pushing the talks toward a pledge-based system (perhaps like an iterative offer-and-review process), in lieu of the Kyoto-style top-down allocations of rights to the atmosphere. This had a defining influence on the Rio+20 Earth Summit in 2012 and will likely only increase in influence.
At the center of the negotiations has been a moral and legal debate surrounding equity: how to balance historical responsibility against current and future emissions limits. Given limited resources, in order to achieve the goal of the convention of preventing “dangerous anthropogenic interference with the climate system,” there will be inevitable trade-offs between efficiency and equity. The repercussions of this decision could easily become the basis for approaches to other multi-lateral issues and, more broadly, alter the structure of development assistance aid.
So, where do the Warsaw negotiations stand? The Durban Platform for Enhanced Action, the track responsible for crafting the treaty language and strengthening ambition, has released a draft decision text. It is the result of a week of tense negotiation that went late into the weekend, and is surprisingly concise. It acknowledges the tectonic shift mentioned above toward a diversity of actors and commitments and lays out basic elements of a treaty (though these will need to be filled out as the week progresses).
The state-run Chinese press have been explicit that long-term finance is the key to success at Warsaw (see, e.g., here and here). One of the commitments brought to Copenhagen was a pledge from industrialized countries to mobilize $100 billion / year by 2020 in aid to help developing countries mitigate and adapt to climate change. China wants more details on how that number is going to be achieved, including setting intermediate targets. This is particularly vexing issue since parties can’t agree on how much aid has already been distributed to meet a 2012 deadline (one analysis says the $30 billion target was reached, while developing countries claim it is mostly existing aid repurposed).
Following the disastrous Typhoon Bopha last year in the Philippines, countries and civil society rallied around a compensation scheme for “loss and damage” resulting from climate change. Typhoon Haiyan ripped through the same island chain just as the negotiations opened this year. Yeb Sano, lead negotiator for the Philippines, electrified the venue with his demand for an institutional fix (including a now worldwide fasting event and a 500k+ Avaaz petition), possibly raising the stakes for success at the conference.
Much work still remains to convince developing countries that the evolving approaches within the UN (“offer-and-review”, voluntary commitments from subnational actors, and the gradual eroding of the 1992 “firewall” between developed and developing countries) are in their best interests. Success at Warsaw will likely hinge on industrialized countries delivering on promises of finance, while generating trust with other parties that more ambitious pledges on mitigation will follow.
Watch video from the conference here: www.climatecolab.org/conference2013/virtually
As international climate negotiators meet this month for the 19th meeting of the UN Conference of Parties (COP19), there’s an increasing realization that top-down efforts to confront climate change aren’t working—or at least, they’re not working quickly enough. Are there ways that large groups of people—even a global community—could work together to take action now? That was the focus of an MIT climate conference last week, entitled “Crowds and Climate.”
“We know how to make real progress on climate change, what we must create is the political will to achieve it. Creating that will requires all of us to engage. It can’t be a top-down process,” said Environmental Defense Fund President Fred Krupp, the Wednesday keynote speaker at the event. “The arch of the moral universe may bend toward justice, but the line on the graph of global emissions won’t bend until we make it do so.”
To help bend that line downward and develop creative innovative ideas to take action on climate change, the conference explored the role new technology-enabled approaches—such as crowdsourcing, social media and big data—could play. It was sponsored by the MIT Center for Collective Intelligence’s Climate CoLab, and co-sponsored by the MIT Energy Initiative, MIT Joint Program on the Science and Policy of Global Change, and MIT Sloan Sustainability.
The conference underscored the aim of the Climate CoLab itself, which looks to shift public engagement on climate change from one of just science or ideology to a much broader and more inclusive participation. It does so by crowdsourcing, through contests, citizen-generated ideas on a range of topics relevant to climate change. The community has been doubling or tripling with each annual contest, and there are now more than 10,500 registered members. The community’s rapid growth shows that there are many smart and creative people around the globe ready to engage in these issues.
“By bringing together experts, policy makers, business people, and many others, we hope the Climate CoLab can help plan—and gain support for—better climate actions than anything we humans would otherwise have done,” said the Director of the MIT Center for Collective Intelligence and Principal Investigator for the Climate CoLab, Prof. Thomas Malone. “Even if we don’t achieve this, engaging crowds in the process will likely increase support for and awareness of the solutions.”
In addition to honoring the 28 winners of this year’s contests, and awarding a Grand Prize winner, the conference gathered a large group of smart and creative people to discuss these issues. The two-day event attracted more than 800 in-person and online attendees.
Organizing Crowds
Using a bottom-up approach to confront climate change first requires building a base, according to Marshall Ganz, senior lecturer in public policy at Harvard University. “What drives movements is not branding, but relationships; …building constituencies at the base,” he said.
To build a base, the crowd needs to be able to relate, said Andrew Hoffman, Holcim (U.S.) Professor of Sustainable Enterprise at the University of Michigan. “As long as it’s this idea in the ivory tower presented by a scientist using a language people don’t understand, they will still question whether they believe that theory or not,” Hoffman said.
Instead, climate change should be tied to things that resonate with people, for example, the rising cost of insurance, “Talk about the ski season to skiers, or about habitat changes to hunters,” said Kate Gordon, Vice President at Next Generation.
Inserting unexpected validators also helps. Bob Inglis, a former Republican congressman from South Carolina and the founder of the Energy and Enterprise Initiative at George Mason University, pointed out that business people can act as good validators, “When smart money starts moving that way, that has a real educational impact on people.”
Ganz and Hoffman both noted that outside factors—such as events—can shift the conversation toward a desired social change. Hoffman used Hurricane Katrina and Superstorm Sandy as examples.
“Sandy created a fundamental change in how we think about climate change, Katrina did not,” Hoffman said. “Katrina hit a minority population that was fundamentally disconnected and had no spokespeople. Sandy hit an affluent population that was politically connected and had Michael Bloomberg.”
Sergej Mahnovski, the director of New York City’s Long Term Planning and Sustainability, backed up this idea that one event can spur change. He noted that New York City’s sustainability planning was going slowly until Sandy hit and brought a sense of urgency amongst the people of New York, and thus, their leaders.
While it may take time to create a crowd, David Yarnold, president of the National Audubon Society, points out that there is a precedence of social movements creating environmental change. The first Earth Day was one of the largest grassroots demonstrations in the nation’s history, and it was followed by the creation of the U.S. Environmental Protection Agency and the passage of the Clean Air Act.
“There is a precedence in the U.S. in terms of environmental and conservation action that demonstrate that when the American people decide that something is a priority, they’ll actually do it,” Yarnold said.
Tools for Change
In the age of Twitter and iPads, technological advances can be used to help create a community and expand their impact. This is as true in the context of climate change as it is in almost any global challenge today.
“In the past, changes had figureheads,” said Practically Green CEO Susan Hunt Stevens. “With Arab Spring, there were some players, but social media ended up being the figurehead… it can be used to bring visibility to the change and connect people.”
Other nontraditional forms of media have aided the climate cause as well.
Pace University Senior Fellow and New York Times Dot Earth Blogger Andrew Revkin gave many examples – including a high school science teacher who posts simple explanatory videos on YouTube for all to watch.
“Just building the capacity for the exchange of ideas across boundaries is really important and I think it can lead to some surprising results,” Revkin said.
Crowds can also help compile big data and turn it into useful information, said Bina Venkataraman, President Obama’s senior advisor on climate change innovation. In addition, she noted crowds play an important role in validating what data is useful and what is not.
But while crowds can validate data, we also need ways to validate crowds, according to MIT Sloan School of Management Professor John Sterman. “If you just have the crowd and you don’t have the ability to test the ideas, nothing’s going to work… learning’s much slower.”
Sterman directs Climate Interactive, an organization that has created a simple climate model that anyone can run on their laptops. He has embedded his model into the Climate CoLab contest so that the crowds’ ideas can be tested instantly using the models to see which ideas work best.
“Our goal is to test whether that actually amplifies the rate at which we can come up with excellent solutions,” Sterman said. “So you have this combination of the talents and wisdom of the crowds with the testing platform that’s enabled by the simulation models that you can run instantly.”
Sterman concluded that the Climate CoLab’s work, and conferences like this one, is needed to further the climate debate and help bring about solutions.
“Climate science needs to continue. But it’s not the bottleneck to progress,” Sterman said. “We need more research, and I think the Climate CoLab enables this research on… how that turns a crowd into a movement and into organizations that can make a difference.”
Anyone from around the world is invited to submit ideas to the Climate CoLab, which is now receiving proposals. Keeping with the crowdsourcing orientation, community members are invited to suggest contests they think can make a difference at http://climatecolab.org.
Watch video from the conference here: www.climatecolab.org/conference2013/virtually
In deciding how best to meet the world’s growing needs for energy, the answers depend crucially on how the question is framed. Looking for the most cost-effective path provides one set of answers; including the need to curtail greenhouse-gas emissions gives a different picture. Adding the need to address looming shortages of fresh water, it turns out, leads to a very different set of choices.
That’s one conclusion of a new study led by Mort Webster, an associate professor of engineering systems at MIT, published in the journal Nature Climate Change. The study, he says, makes clear that it is crucial to examine these needs together before making decisions about investments in new energy infrastructure, where choices made today could continue to affect the water and energy landscape for decades to come.
The intersection of these issues is particularly critical because of the strong contribution of the electricity-generation industry to overall greenhouse-gas emissions, and the strong dependence of most present-day generating systems on abundant supplies of water. Furthermore, while power plants are a strong contributor to climate change, one expected result of that climate change is a significant change of rainfall patterns, likely leading to regional droughts and water shortages.
Surprisingly, Webster says, this nexus is a virtually unexplored area of research. “When we started this work,” he says, “we assumed that the basic work had been done, and we were going to do something more sophisticated. But then we realized nobody had done the simple, dumb thing” — that is, looking at the fundamental question of whether assessing the three issues in tandem would produce the same set of decisions as looking at them in isolation.
The answer, they found, was a resounding no. “Would you build the same things, the same mix of technologies, to get low carbon emissions and to get low water use?” Webster asks. “No, you wouldn’t.”
In order to balance dwindling water resources against the growing need for electricity, a quite different set of choices would need to be made, he says — and some of those choices may require extensive research in areas that currently receive little attention, such as the development of power-plant cooling systems that use far less water, or none at all.
Even where the needed technologies do exist, decisions on which to use for electricity production are strongly affected by projections of future costs and regulations on carbon emissions, as well as future limits on water availability. For example, solar power is not currently cost-competitive with other sources of electricity in most locations — but when balanced against the need to reduce emissions and water consumption, it may end up as the best choice, he says.
“You need to use different cooling systems, and potentially more wind and solar energy, when you include water use than if the choice is just driven by carbon dioxide emissions alone,” Webster says.
His study focused on electricity generation in the year 2050 under three different scenarios: purely cost-based choices; with a requirement for a 75 percent reduction in carbon emissions; or with a combined requirement for emissions reduction and a 50 percent reduction in water use.
To deal with the large uncertainties in many projections, Webster and his co-authors used a mathematical simulation in which they tried 1,000 different possibilities for each of the three scenarios, varying each of the variables randomly within the projected range of uncertainty. Some conclusions showed up across hundreds of simulations, despite the uncertainties.
Based on cost alone, coal would generate about half of the electricity, whereas under the emissions-limited scenario that would drop to about one-fifth, and under the combined limitations, it would drop to essentially zero. While nuclear power would make up about 40 percent of the mix under the emissions-limited scenario, it plays almost no role at all in either the cost-alone or the emissions-plus-water scenarios.
“We’re really targeting not just policymakers, but also the research community,” Webster says. Researchers “have thought a lot about how do we develop these low-carbon technologies, but they’ve given much less thought to how to do so with low amounts of water,” he says.
While there has been some study of the potential for air-cooling systems for power plants, so far no such plants have been built, and research on them has been limited, Webster says.
Now that they have completed this initial study, Webster and his team will look at more detailed scenarios about “how to get from here to there.” While this study looked at the mix of technologies needed in 2050, in future research they will examine the steps needed along the way to reach that point.
“What should we be doing in the next 10 years?” he asks. “We have to look at the implications all together.”
In addition to Webster, the work was carried out by graduate student Pearl Donohoo and recent graduate Bryan Pelmintier, of the MIT Engineering Systems Division. The work was supported by the National Science Foundation, the U.S. Department of Energy, and the Martin Family Foundation.
Global population is expected to rise from about 7 billion today to close to 11 billion by the end of the century. This growing population will increase the demand for food, putting further strain on global land and water resources already feeling the pressures of climate change. Responding to the urgency of these challenges, the MIT Joint Program on the Science and Policy of Global Change brought together experts from academia and industry at a food symposium on November 5th, “Feeding the World without Consuming the Planet.”
MIT Vice President Claude Canizares joined Joint Program on Global Change Co-Director Ron Prinn in opening the event. He highlighted MIT’s dedication to expanding research on agriculture, as urged by President Obama’s Council of Advisors on Science and Technology in a report published last December. He also emphasized the Institute’s long history of forming industry collaborations to confront the world’s greatest challenges.
“MIT’s 150-year history of being devoted to the industrial arts makes us very comfortable to work closely and in real partnership with industry. I can’t think of a more important problem for us to tackle,” said Canizares at the event, which included experts from Cargill, Coca-Cola Co., Mosaic Company, Weyerhaeuser Company and Bunge Limited.
Cargill Vice Chairman Paul Conway also gave opening remarks outlining the challenges of increased food consumption, accelerating urbanization, demands for biofuels and variability in climate.
“We see climate change as a critical risk. We have to prepare ourselves to make sure we adapt,” said Conway, who also encouraged additional research in science and technology. “To ignore some tools that are available to us that have had a significant impact—particularly in terms of the reduction of chemicals—would be foolish.”
Agricultural Resources and Inputs
Joint Program Co-Director John Reilly kicked off the first session of the event with an overview of MIT’s work on modeling water stress, resource demands, variability in temperature and precipitation patterns, and the economic impacts of climate change on food prices.
“We need to better understand local and regional climate changes and extremes to improve agriculture,” said Reilly, of which the Joint Program is already studying with their Integrated Global System Model (IGSM) — a tool that connects Earth and human systems to better predict future climate changes.
Industry is also doing its part to maximize yields and adapt to climate change. Reilly’s session focused on two key industries in particular: forestry and fertilizers.
As fertilizer companies meet growing productivity demands, they must focus on improving resource inefficiencies and misallocations of fertilizer in the developing world, said Michael Rahm of the Mosaic Company. Meanwhile, timberlands management could help mitigate climate change, according to Robert Ewing of the Weyerhaeuser Company. Weyerhaeuser is also working with Chevron to research how timber scraps could be used in biofuel production.
Agricultural Commodity Markets, Food and Consumers
The second session of the event progressed up the food production chain and looked at the impacts on prices and trade.
Describing the challenge of growing food prices, Professor Thomas Hertel from Purdue University said that there are many factors to watch including biofuel expansion, oil prices, technical capabilities, drops in research and development, and climate change. Hertel also explained income rises in the developing world will encourage diets to change and require more land intensive agriculture. Improved efficiency in trade and technology will be essential in meeting the demands of growing affluent societies.
Stewart Lindsey of Bunge Limited agreed with the importance of trade, “It plays a very important role in the world,” he said. “It really is a mechanism that gives deficit countries—countries that don’t have enough food to ensure security—the ability to do that in a pinch.”
Only 15 percent of global grains and oilseeds are exported today. By expanding global trade of agriculture, Lindsey suggested we should urge countries to be more efficient by growing and exporting foods based on their locally available resources and climate conditions.
As the food and agriculture industry continues to prepare for climate change and increased food demands by supporting agricultural trading, optimized yields and sustainable agricultural practices, Reilly emphasized the important role of academia in such efforts.
“We look forward to continuing this conversation with collaborators in industry,” Reilly said, “in order to improve our understanding of all these challenges, and find the best ways to adapt to our changing climate and resource demands.”
Watch videos from the event here: http://globalchange.mit.edu/foodsymposium
Read about our coverage on social media here: http://storify.com/MITGlobalChange/feeding-the-world-without-consuming-the-planet
MIT students and faculty interested in climate change’s impact on agriculture and food production gathered on the University’s campus Tuesday to hear a half-day of dialogue in a Food Symposium sponsored by the MIT Joint Program on the Science and Policy of Global Change. In his keynote address, Cargill’s Vice Chairman Paul Conway said that when faced with the potential impact of climate change one should think about the Stockdale Paradox and confront brutal reality at the same time one remains optimistic. He also said that climate change was a critical issue for the company and understanding it would help Cargill adapt and deliver on its strategy to be balanced, diverse and resilient.
Conway’s remarks focused on the trends impacting food security, including urbanization, changing diets and biofuels. He fielded questions about how intensification can be done in a sustainable way and how Cargill could help reduce food waste.
The topic of climate change and its potential impact on food production is timely, as the Intergovernmental Panel on Climate Change (IPCC) is expected to issue in March its latest assessment of the impact of rising temperature and climate variability on the global food system. The report was leaked last week, and the New York Times featured a story about the potential risks to food supplies.
Other panelists included Thomas Hertel, professor of agricultural economics at Purdue University, who discussed the impact of population, impact of income growth on food prices, and the impact of rising temperature on yields for wheat and maize. Hertel concluded that agricultural productivity growth holds the key to protecting the environment and improving food security, but climate change will make this harder. And he believes that rising incomes and declining real prices offer the prospect of reducing the number of malnourished in the world significantly.
Cargill has been a sponsor of the MIT Joint Program on the Science and Policy of Climate Change since 2008. MIT’s program is one of several university programs Cargill funds that are helping the company better understand climate science, impact on crop yields, adaptability, sustainability and implications for food security.
Julia Pyper, E&E reporter
Published: Monday, November 5, 2013
Targets set in China's latest five-year plan aimed at reducing harmful air pollution from the burning of fossil fuels will result in unintended reductions in carbon dioxide emissions that exceed the country's near-term CO2 reduction goals, according to a new study by the Massachusetts Institute of Technology.
China's rapid economic development has led to a spike in pollution from power plants and the industrial sector. To address pollutants that cause acid rain and smog, the government of China established regulations under the 12th five-year plan to reduce emissions of sulfur dioxide (SO2) by 8 percent and nitrogen oxides (NOx) by 10 percent below 2010 levels by 2015.
The plan also calls for a 17 percent reduction in carbon dioxide intensity from 2010 levels.
In a study published this week in the journal Global Environmental Change, MIT researchers found that China's SO2 and NOx regulations alone could reduce carbon dioxide intensity by 20 percent, surpassing its official near-term target.
"It is clear that the unintended benefits of the regulations are substantial and would allow the government to improve air quality, while also cutting the most potent greenhouse gas. We have also learned that carbon emissions may not rise as high as some forecasts suggest, if concerns about conventional pollutants lead to air-pollution reduction policies," said Kyung-Min Nam, lead author of the study and a postdoctoral associate with the MIT Joint Program on the Science and Policy of Global Change.
Carbon dioxide and conventional air pollutants, like SO2 and NOx, come from the same sources, most often the combustion of fossil fuels. Switching from coal to natural gas or reducing energy use in response to air pollution constraints, therefore, will also reduce carbon dioxide emissions.
It will reduce costs, too. MIT researchers estimate that China's SO2 and NOx regulations will produce $3 billion in reduced compliance costs with carbon dioxide intensity targets.
"Considering that the current CO2 target can be attained by the secondary benefits of the SO2 and NOx regulations, policymakers would do well to coordinate the regulatory efforts," said Valerie Karplus, a co-author of the study and the director of the MIT Joint Program's China Energy and Climate Project, in a statement. "Currently, they have room to adopt more ambitious CO2 reduction policies, but the impact will hinge on effective implementation."
The study finds that China could meet its near-term carbon and pollution goals while still expanding the use of coal. However, this path will have a lock-in effect that makes it more expensive to cut down emissions in future. China can achieve cost savings for industries by requiring earlier action and investment in long-term emissions targets, according to the authors.
"China's local air pollution is extremely serious, and the cost of not acting is too big to ignore," Nam added.
In most of China's major cities, particulate matter concentration levels exceed the World Health Organization's guideline levels by a huge margin, he said. Many studies estimate that health damage from the excess pollution in China is substantial, reaching between 4 and 7 percent of gross domestic product.
"So while reducing pollution in China may require non-trivial compliance costs, it will also increase the welfare of local citizens substantially," Nam said.
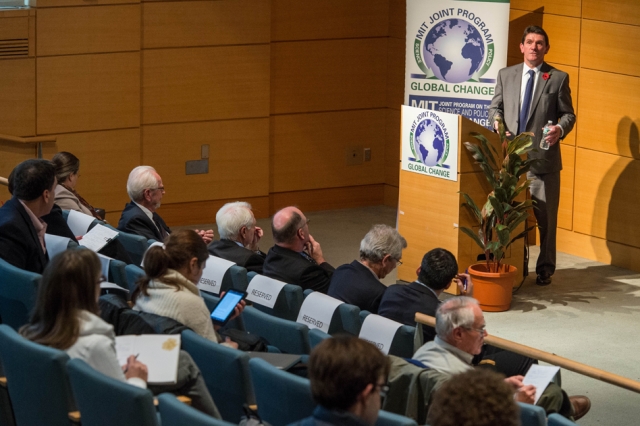
Confronting global environmental change is one of the greatest challenges of our time. Changes to water, land and climate will affect the future of food and agriculture.

