
News + Media
The Atlantic reports on an MIT study that concludes that cost of limiting carbon emissions would pay for itself in human health benefits.
"
James Hamblin
The Atlantic
The polar ice caps feel remote. The threat of orioles permanently leaving Baltimore for cooler climates might be a little more compelling. But researchers are learning that the most effective way around climate-policy ambivalence is to invoke imminent dangers to human health. "What's killing me today?" with emphasis on killing and me and today.
For one, when there is more carbon dioxide in the environment, plants produce more pollen, which is no good for allergies and asthma. Rutgers allergist Leonard Bielory recently warned that pollen counts are projected to double by 2040. Likewise, U.S. foresters recently calculated that trees seem to be averting around $6.8 billion in human health costs annually, largely due to mitigating effects of air pollution (even if they do produce pollen). And already the World Health Organization is warning that air pollution is responsible for one out of every eight human deaths, largely because combustion of fossil fuels results in invisible airborne particles that get lodged in our lungs and suspended in our blood.
But is that worth the cost of implementing policies that limit carbon emissions? Some say yes.
Yesterday researchers released findings that say an economy-wide cap on carbon emissions stands to pay for itself about 10 times over in near-term human medical benefits, specifically reductions in costs associated with respiratory diseases, like asthma, and premature death. A standard, economy-wide cap and trade program, the MIT-based research team found, would result in a net benefit of $125 billion in human health costs. The work is published in the journal Nature Climate Change.
“We were looking at ozone and particulate matter, the two biggest air quality issues in the United States,” Tammy Thompson, a research scientist at Colorado State University with the Cooperative Institute for Research in the Environment, told me.
The Christian Science Monitor writes about an MIT climate change study released Sunday, indicating that the cost of slashing coal-fired carbon emissions would be offset by reduced spending on public health. The EPA-funded study examined climate change policies similar to those proposed by the Obama administration in June.
Jared Gilmour
Christian Science Monitor
President Obama’s controversial plan to phase out coal and slash carbon emissions is an expensive one. But a new study suggests it could be cheaper than the alternative: pollution, poor air quality, and accompanying health costs.
Cutting emissions might lower health spending so drastically that the US could end up saving ten times more than it would cost to implement carbon reductions, according to a Massachusetts Institute of Technology study published Sunday in the journal Nature Climate Change.
Environmentalists have long argued that curbing pollution is good for protecting local habitats and public health. Recently, though, the push for tighter environmental protections has sometimes shifted the focus from human health and conservation to climate change. The MIT study ties both environmental paradigms together, demonstrating how policies targeting carbon emissions can boost public health by reducing the more conventional pollutants emitted alongside greenhouse gases. Those conventional pollutants include particulate matter and carbon monoxide, which officials link to increased incidence and severity of illnesses like asthma, heart disease, and lung cancer.

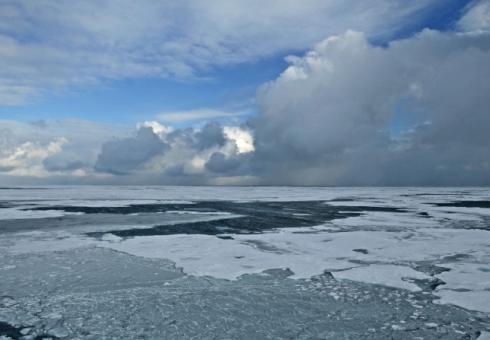
According to MIT researchers, ocean circulation explains why the Arctic feels the effects of global warming much more than the Antarctic.
Genevieve Wanucha
MIT News
Over recent decades, scientists have watched a climate conundrum develop at the opposite ends of Earth: The Arctic has warmed and steadily lost sea ice, whereas Antarctica has cooled in many places and may even be gaining sea ice. Now, MIT researchers have a better understanding of the elemental processes behind this asymmetric response of the polar regions to the effects of human-induced changes to the climate.
In a paper published in Philosophical Transactions of the Royal Society, John Marshall, the Cecil and Ida Green Professor of Oceanography at MIT, and his group investigated this phenomenon by considering ocean dynamics. The ocean, because of its ability to absorb and transport enormous amounts of heat, plays a critical role in climate change. The authors argue that ocean circulation can explain why the Arctic has warmed faster than the Antarctic.
In MIT computer simulations of the ocean and climate, excess heat from greenhouse gas emissions is absorbed into the Southern Ocean around Antarctica and in the North Atlantic Ocean, but it doesn't linger. Instead, the moving ocean redistributes the heat. In the Southern Ocean, strong, northward-flowing currents pull the heat towards the equator, away from the Antarctica. In the North Atlantic Ocean, a separate northward-flowing current system shunts the heat into the Arctic. So while Antarctica warms only mildly, the Arctic Ocean’s temperature increases quickly, accelerating sea-ice loss and warming the Arctic atmosphere.
The model results reveal the differing responses to greenhouse gases in each region, with the Arctic warming more than twice as rapidly as the Antarctic. They also add confidence to the existing predictions of enormous future changes up north. By mid-century, the Arctic may warm so much that the oceans could go sea-ice free in the summers.
Marshall’s group also showed that the ocean's response to the ozone hole can help explain the lack of warming to date around Antarctica. The millions of square feet of deterioration in the ozone over Antarctica was caused by emissions of the man-made pollutants chlorine and bromine, chlorofluorocarbons, which peaked at the turn of the century and are now slowly dwindling.
When they introduced an ozone hole into their model, the winds over the Southern Ocean grew faster and shifted southward, consistent with the observed wind changes around Antarctica. They found that this intensification of winds initially cools the sea surface and expands sea ice, but then a slow process of warming and sea ice shrinkage takes over. This warming happens, they suggest, because the stronger winds eventually dredge up to the surface relatively warm waters from the deep ocean. “Around Antarctica, the ozone hole may have delayed warming due to greenhouse gases by several decades,” Marshall says. “I'm tempted to speculate that this is the period through which we are now passing. However, by 2050, ozone hole-effects may instead add to the warming around Antarctica, an effect that will diminish as the ozone hole heals.”
"The researchers present a useful and timely reminder that the ocean is not a passive bath tub when it comes to climate change, but play an active role in shaping the spatial structure of climate change," says Richard Seagar, the Palisades Geophysical Institute/Lamont Research Professor at the Lamont-Doherty Earth Observatory, who was not involved in the study. "The work will likely motivate a lot of future work to better determine how the spatial patterns and temporal evolution of past and future climate change are influenced by an active ocean and its coupling back to the atmosphere."
The framework offers a new ocean-centric picture of the effect of greenhouse gases and the ozone hole on polar climates. The slight cooling measured around Antarctica today might be a consequence of the temporary cooling influence of the ozone hole. But as the century proceeds, both of the human-induced effects on the climate may combine to warm the waters around Antarctica. This MIT model joins several other recent demonstrations of the concerning, but uncertain, future effects of climate change on Antarctic sea ice and glaciers and, in turn, ecosystems and sea-level rise.
This work was jointly supported by the MIT Joint Program on the Science and Policy of Global Change.
For more information on the Joint Program's recent research on how the ocean affects climate, see:
The Ocean's Role in Regional Climate Change: Why the Arctic is warming faster than the Antarctic
Related publications:
The ocean's role in the transient response of climate to abrupt greenhouse gas forcing
Reprint 2014-20
The ocean's role in polar climate change: asymmetric Arctic and Antarctic responses to greenhouse gas and ozone forcing
Reprint 2014-21
National Journal || Ben Geman writes about MIT Joint Program researchers' recent analysis of what the world can expect from upcoming climate policy negotiations.
Ben Geman
National Journal
Don't expect too much from the global climate-change accord that's expected to emerge from high-stakes international talks in Paris next year.
A new MIT study concludes that even if negotiators reach a deal at the United Nations conference, it probably won't be enough to limit global temperature increases to 2 degrees Celsius above pre-industrial levels. That's the level many scientists say would help stave off some of the most dangerous and disruptive effects of climate change.
Here's the study's bottom line on what to expect from the so-called Conference of the Parties 21 in Paris: "Based on our expectations for the architecture of a COP-21 agreement, and our predictions about the national contributions likely to come forth under it, our analysis concludes that these international efforts will indeed bend the curve of global emissions. However, our results also show that these efforts will not put the globe on a path consistent with commonly stated long-term climate goals," states the paper by economics professor Henry Jacoby and Y-H Henry Chen, who both work with MIT's Joint Program on the Science and Policy of Global Change.
The 2°C ceiling has been highly optimistic for a while, as global greenhouse-gas emissions continue to soar.
The Hill reports on a new Joint Program Report detailing MIT researchers' expectations for 2015 UN climate policy negotiations.
Laura Barron-Lopez
The Hill | Energy & Environment
Negotiations among global leaders in Paris next year meant to mitigate climate change and keep the global temperature below 2 degrees Celsius are likely to fail, according to a new study.
The Massachusetts Institute of Technology (MIT) report released Wednesday, concludes that the outcome of next year's United Nations (UN) talks in Paris probably won't put the globe on the path to limiting temperature increases to 2 degrees Celsius.
The researchers looked at the major players in the talks from the U.S, to China and European Union. The report details the steps each has taken to fight climate change and the emissions reductions they are working to set individually to model what a final agreement might look like.
U.S. involvement in any future climate work, is "crucial," the report states. It adds that the deal reached next year can be expected to "bend the curve of global emissions but will not put the globe on the path consistent with commonly stated long-term climate goals."
The report also states that the negations between leaders over the next 18 months heading into the talks will "heavily" influence global greenhouse gas emissions as far out as 2045 or 2050.
"We see emissions increasing through 2030 and, without additional international agreement, continuing to increase in the following decades," said MIT economics professor Henry D. Jacoby in a questionnaire accompanying the study. "That raises the question, if it’s obvious in the early stages of the negotiation that we’re not getting on a path to temperature goals, what will be the nature of the follow-up process? We should be starting to have that discussion as well."
President Obama will attend a UN climate summit in New York next month to help build momentum for the talks in Paris. The administration's climate agenda at home and abroad faces harsh criticism from Republican lawmakers who oppose the president's domestic regulations.
Opponents of climate policies argue that regulations on U.S. power plants will have little if any impact on global emissions, and would hurt the economy.
But since the administration's proposed the new carbon pollution standards on existing power plants, Environmental Protection Agency chief Gina McCarthy has said the rules are "internationally changing the tone of the conversation."
In NY Times' The Upshot, Cornell University economics professor Robert H. Frank writes an Op-Ed debunking myths about climate change, featuring MIT's Integrated Global System Model.
by Robert H. Frank
NY Times | The Upshot
[Excerpt from full article]
Myth 6: Penalizing greenhouse gas emissions would violate people’s freedom.
As John Stuart Mill, the British political economist, argued, people should be free to do as they please, provided they don’t cause undue harm to others. But greenhouse gases have already caused great harm and threaten much worse. Mill’s cost-benefit framework provides no reason for thinking that someone’s freedom to escape the small burden of CO2 taxation should trump other, vastly more important freedoms. To the contrary, he said, restrictions on individual liberty are needed when the health and safety of the great mass of people and the purity of the natural environment are at stake.
In 2009, the respected M.I.T. global climate simulation model estimated that if we do nothing to curb greenhouse emissions, there’s a 10 percent chance that temperatures will rise by more than 12 degrees Fahrenheit by century’s end, causing wholesale destruction of life as we know it.
There’s still time to eliminate this catastrophic risk at surprisingly modest cost. If we fail to act, future historians may wonder from behind high sea walls why we allowed the more effective responses we could have pursued to be blocked by an easily debunked collection of myths.
Read the full article on NYTimes.com.
CBS NEWS || As our need for food rises, our ability to produce that food may be lowered by climate and air quality changes, according a to a study just published in Nature Climate Change.
Eliene Augenbraun
CBS News
The world will need 50 percent more food by 2050 due to both an increasing population and a shift toward a more Westernized diet in developing countries. But as our need for food rises, our ability to produce that food may be lowered by climate and air quality changes, according a to a study just published in Nature Climate Change.
Researchers from MIT and Colorado State University found that if everything else stays as it is today, by 2050 global warming may reduce world crop yields by about 10 percent.
But world crop yields face more challenges than just rising temperatures. Ozone pollution also hurts crops, while being harder to quantify. Some crops are hurt most by extreme temperature swings, others more by ozone.
"Ozone pollution can also be tricky to identify ... because its damage can resemble other plant illnesses, producing flecks on leaves and discoloration," Colette Heald, an author of the study and associate professor of civil and environmental engineering (CEE) at MIT, said in a press release.
While heat and ozone can each damage plants on their own, the two factors also interact. For example, warmer temperatures increase ozone production. The research team calculated that 46 percent of damage to soybean crops on very hot days that had previously been attributed to heat is actually caused by ozone.
The researchers used climate models to map daily temperature variations region by region, comparing the world of 2000 with the world as it is projected to be in 2050. In an email to CBS News, Heald explains, "We developed a statistical model of crop yields based on the historical climate and crop data. We used national crop data from 1960-2000. So effectively our model is based on the observed relationships."
Under some scenarios, the researchers found that pollution-control measures could make a major dent in expected crop reductions. For example, while global food production was projected to fall by 15 percent under one scenario, ozone reduction in an alternate scenario could reduce that drop to 9 percent.
The study looked at four major crops: soybeans, rice, maize, and wheat, which make up half the calories humans consume worldwide. Given its profound effect on many important crops, air pollution will contribute to undernourishment in the developing world. Using the pessimistic air-quality projection, rates of malnourishment in developing countries might increase from the current 18 percent to 27 percent by 2050.
Agricultural production is '"very sensitive to ozone pollution," Heald said in the press release, showing "how important it is to think about the agricultural implications of air-quality regulations. Ozone is something that we understand the causes of, and the steps that need to be taken to improve air quality."
The researchers note in their paper that they did not explore the effect of developing ozone-tolerant crop strains in this study, but "considering the challenge of implementing such a strategy, the questionable efficacy of other crop management practices, as well as the public health co-benefit of ozone control, ozone regulation may prove to be a practical and preferable alternative to help secure global food production." They hope that "farmers, agricultural policy makers, and air quality managers" will work together to promote food security.
The study also did not factor in the effect of rising carbon dioxide (CO2) levels on crop yields. Heald told CBS News, "The focus of our study was looking at the climate and ozone effects on crop yields, both because we thought this was an important contrast to draw, and because these effects are better quantified. The net effect of CO2 on food is less clear -- CO2 fertilizes plants and so we could expect elevated yields under higher CO2, [but] recent work has shown that plants grown under these high CO2 conditions are less nutritious. So one might need to grow more food to meet nutrition demands."

Climate change could pose an even greater threat to global food production than previously thought, according to new research. Rising temperatures will not only damage heat-sensitive crops – they’ll also increase toxic air pollution, which will harm crops even further.
Maria Gallucci
International Business Times
Climate change could pose an even greater threat to global food production than previously thought, according to new research. Rising temperatures will not only damage heat-sensitive crops – they’ll also increase toxic air pollution, which will harm crops even further.
The study, out this week in the journal Nature Climate Change, is the first to explore how this interaction between warming temperatures and air pollution affects staple crops. Scientists have long known that the two can independently damage crops and reduce yields, but “nobody has looked at these two together,” Colette Heald, one of the co-authors and an associate professor of civil and environmental engineering at MIT, said in a statement.
She said the findings highlight the need for stronger air-quality regulations, especially given the looming global food crisis. The world is expected to need about 50 percent more food than it does today by 2050, due to population growth and the increasing demand for cereal-based diets in the developing world. But warming temperatures may reduce global crop yields by about 10 percent over that same period; left unchecked, air pollution could bump that number up even higher, the authors said.
In the past decades, scientists have increasingly focused on studying the potential effects of climate change on all aspects of life, including agriculture. Last week, a separate study by U.S. researchers found that the odds of a reduction in corn and wheat production are 20 times higher than they would be without human-induced global warming. Earlier this year, a United Nations climate change report found that falling agricultural yields would hit impoverished people the hardest.
The earth sciences field in particular has seen a big shift in how researchers study the climate, with chemists, biologists and ecosystems experts collaborating more closely than in the past. “They used to not talk to each other much, but now they have to because of these kind of [climate] impacts,” Amos Tai, an assistant professor at The Chinese University of Hong Kong and co-author of the Nature Climate Change study, told International Business Times.
For the ozone study, the MIT-affiliated researchers focused on rice, wheat, corn and soy crops, which together account for more than half of the calories that humans consume worldwide. The team observed that warmer temperatures significantly increase production of ozone, a colorless toxic gas, due to the reactions of certain chemical compounds with nitrogen oxides – greenhouse gases that come from vehicle tailpipes and power plant smokestacks.
For soybeans, the researchers found that 46 percent of damage was actually caused by increased ozone levels – and not by increased heat, as had been previously thought. About one-quarter of wheat damage and nearly 10 percent of corn damage is primarily due to ozone, while the results for rice were inconclusive, according to the study.
The interaction between temperatures and pollutants varies considerably from region to region, and each crop is affected differently, the report’s authors said. Wheat in all the major production regions is more sensitive to ozone pollution than to higher temperatures, for instance. Corn and soybeans, however, are more vulnerable to high heats.
Government policies will also play a major role in determining the extent of pollution-related crop losses. Under one scenario, the researchers projected that global food production could fall by 15 percent, but when they accounted for large emissions decreases, that figure shrank to a 9 percent drop in food production. In each region, the outcome “will depend on domestic air-pollution policies,” Heald said. “An air-quality cleanup would improve crop yields.”
The United States and parts of Asia – namely South Korea and Japan – will be least affected by the ozone-climate effect, the study found. That’s because “even in the worst-case scenario, which is business-as-usual, we still expect that ozone is going to decrease in the future because of ozone regulations in these particular countries,” Tai said in the phone interview.
China and South Asia, on the other hand, will see the most ozone-related damage to wheat, rice and soybean crops because of the chronically high levels of toxic air pollution. Even corn, which is generally more vulnerable to heat than ozone, will suffer significantly from poor air quality.
Tai said the findings should serve as a wake-up call for the government planners and agricultural experts who are working to protect the world’s food supplies from global warming. Efforts to improve irrigation in sun-scorched regions, or to replace sensitive crops with more resilient varieties, could be less effective if ozone pollution keeps dirtying the air. “If you do not control your ozone, then anything that you do through climate adaptation may not realize the full potential, because ozone will just offset your benefits,” Tai said.
The study is proof that countries should invest more in renewable sources like solar and wind energy and less in pollution-intensive fossil fuels, Denise Mauzerall, a professor of environmental engineering and international affairs at Princeton University, who was not involved in the MIT research, said in a statement. “The increased use of clean energy sources that do not emit greenhouse gases or conventional air pollutants … would be doubly beneficial to global food security, as they do not contribute to either climate change or increased surface-ozone concentrations,” she said.
Thomson Reuters || Controlling air pollution could help curb projected declines in global food supplies, a new study says, suggesting policymakers should consider both climate change and ozone pollution in efforts to ensure the world has enough food.
Megan Rowling
Thomson Reuters Foundation
Controlling air pollution could help curb projected declines in global food supplies, a new study says, suggesting policymakers should consider both climate change and ozone pollution in efforts to ensure the world has enough food.
Scientists have largely neglected the interactions between rising temperatures and ozone pollution, which is known to damage crops. But the complex linkages can be significant, said the study, published in the latest issue of the journal Nature Climate Change.
It explored the global production of four food staples - rice, wheat, corn and soy - finding that effects will vary between regions, and some crops are more strongly affected by one of the two factors. Wheat is very sensitive to ozone exposure, while corn is more adversely impacted by heat, for example.
Warmer temperatures can increase ozone production, said researchers at Massachusetts Institute of Technology (MIT), who carried out the study. Ozone is a gas - a form of oxygen - that is explosive and toxic.
Given that farm production is very sensitive to ozone pollution, the study shows "how important it is to think about the agricultural implications of air-quality regulations. Ozone is something that we understand the causes of, and the steps that need to be taken to improve air quality,” said Colette Heald, one of the authors and an MIT associate professor of civil and environmental engineering.
In the United States, for example, tougher air quality regulations will likely lead to a sharp drop in ozone pollution, mitigating its impact on crops. In other regions, the outcome will be shaped by domestic air pollution policies, Heald said. “An air-quality cleanup would improve crop yields,” she added.
The researchers found air pollution will play a part in shaping undernourishment in developing countries. Under a pessimistic air quality scenario, the malnutrition rate may increase from 18 to 27 percent by 2050. Under a more optimistic scenario, it would still go up but the increase would be cut almost in half.
Global warming alone may reduce crop yields globally by about 10 percent by 2050, the study said. But under some scenarios, pollution control measures could offset a proportion of the expected declines.
The damage caused by ozone pollution can be hard to identify, because it resembles other plant illnesses, producing flecks on leaves and discoloration, MIT said.
The researchers found, for example, that 46 percent of damage to soybean crops that had previously been attributed to heat was actually caused by increased ozone.
The projections exclude the complex effect of rising levels of carbon dioxide, a major greenhouse gas that could also help stem falls in global food supplies, they noted.
Denise L. Mauzerall, a professor of environmental engineering at Princeton University who was not involved in the study, described the finding that air pollution controls could improve agricultural yields and partially offset the negative effects of climate change on yields as "important".
"The increased use of clean energy sources that do not emit either greenhouse gases or conventional air pollutants, such as wind and solar energy, would be doubly beneficial to global food security, as they do not contribute to either climate change or increased surface-ozone concentrations,” Mauzerall said in a statement.
(Editing by Ros Russell; rosalind.russell@thomsonreuters.com)