
News + Media
John Reily, codirector of the MIT Joint Program, talks with Climate Central about the 2014 Climate and Energy Outlook's findings on global water stress.
Bobby Magill
Climate Central
Water stress — the general scarcity of freshwater for people who need it — is considered by many scientists as one of the biggest challenges facing humanity and struggling ecosystems in a world increasingly affected by climate change.
Studies differ on how much the world’s growing population will be affected by the growing difficulty of finding freshwater, but a new report by researchers at the Massachusetts Institute of Technology have found that climate change could actually provide more water to people in some parts of the globe while reducing freshwater for other areas.
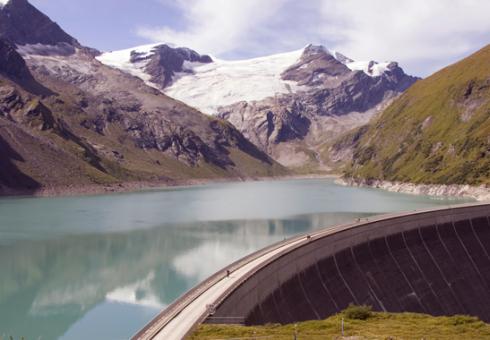
Global warming may increase the overall amount of freshwater flowing in rivers worldwide by about 15 percent, easing water scarcity in many places, including the U.S. Midwest, according to MIT’s Energy and Climate Outlook 2014, released Monday.
By the end of the century, during which time greenhouse gas emissions could double globally, the MIT outlook projects that water scarcity could also ease in Mexico, Saudi Arabia, Libya, China and Western Europe. In other places, water stress could worsen, especially in the U.S. Southwest, Pakistan, Turkey, South Africa and parts of North Africa.
“All climate models predict a speedup of the hydrological cycle with warmer temperatures,” said the study’s lead author, John Reilly, co-director of the Joint Program on the Science and Policy of Global Change at MIT’s Center for Environmental Policy Research. “That means faster evaporation, more moisture in the atmosphere and more rainfall.”
MIT researchers project that while more moisture in the atmosphere will increase freshwater flow 15 percent globally by the end of the century, consumption of freshwater for all human uses worldwide is expected to increase 19 percent, including water for industrial, domestic and agricultural uses.
Of those uses, the outlook shows that domestic freshwater consumption could double from 348 billion cubic meters in 2010 to 698 billion cubic meters in 2100, and industrial use of water could increase from 763 billion cubic meters to 1,098 billion cubic meters, or about 45 percent. Irrigation use is projected to decline slightly worldwide.
But more freshwater doesn’t paint the full picture. In a warming world, how and if that water can be made available for people to use gets complicated.
Exploding human populations may overwhelm water supplies, creating new areas of water stress, according to the outlook.
“This water stress arises because of increased water demand, and in some cases reduced runoff,” Reilly said. “As with almost all climate models, we project more precipitation poleward, and generally drier conditions in subtropical regions.”
And, freshwater availability depends on how and when it falls from the sky.
“Water stress, or not, is very much a function of precipitation in the right place at the right time, and in the right form,” Reilly said.
Rain may begin to fall at times when it can’t be used for irrigation or can’t be captured for storage in reservoirs, he said.
A big concern is precipitation falling as rain rather than snow, or snowpack melting earlier in areas that depend on snowmelt, such as much of the western U.S., he said.
“Snowpack is nature’s water storage, slowly releasing water far into summer dry months and therefore providing even timing even when summers are dry,” Reilly said. “With less snowpack storage, we would need to make up for it by building reservoirs where possible.”
A drought-ravaged village in Mauritania. Credit: United Nations/flickr Building new reservoirs is a costly proposition, and they’d have to be built to handle the added challenge of capturing water from extreme rainfall.
“There is a general conclusion that more rain is likely to come in heavier downpours, with longer periods in between,” he said. “So that raises the specter of both flooding and drought because in a heavy downpour most of the water runs off, and unless there is man-made storage somewhere, it quickly ends up in the sea, and is no longer fresh water.”
That’s a major concern in Rocky Mountain states such as Colorado, which contains the headwaters of some of the most important rivers in the West, including the Colorado River, which provides water to drought-stricken Phoenix and Los Angeles.
Spring snowmelt in Colorado could come up to 17 days earlier than today, and some rivers the state relies on for fresh water supplies could see streamflows decline by up to 35 percent, according to a 2012 Colorado climate vulnerability study.
“As the climate warms, more water will evaporate and sublimate from mountain snowpacks before it ever reaches reservoirs, and agricultural demand will rise,” meaning that there will be less water to go around as a booming population conflicts with a decreasing and less predictable water supply, Colorado State University atmospheric scientist Scott Denning told Climate Central in January.
The MIT report cautions that any projections of regional precipitation patterns and the processes that control runoff from mountain snowpack in a warming world are extremely uncertain, and rain and snowfall are likely to vary widely from year to year and decade to decade.
Not all studies focusing on water security have shown water stress easing much at all in a warming world.
A 2013 study by researchers at the Potsdam Institute for Climate Impact and Research showed that declining precipitation and increasing evapotranspiration will strain water supplies in many areas, especially the U.S. Southwest, affecting 2 billion people globally.
A Pacific Northwest National Laboratory (PNNL) study published in August showed that without any climate policy curbing global greenhouse gas emissions, half of the world’s population is will be living under “extreme” water scarcity by the end of the century.
These studies reach different conclusions because there are multiple ways to measure water stress: Some studies focus only on water supply, while others, such as the MIT report, focus on both supply and demand. Each study also uses its own assessment of hydrology, the effects of climate change and other factors, said PNNL climate scientist Mohamad Hejazi, lead author of the PNNL water scarcity study.
In some cases, studies may significantly underestimate overall water deficit in some areas in a warming world, he said.
“This (MIT) study constitutes one plausible scenario, but it is not definitive,” he said.
MIT’s report was published Monday following the United Nations Climate Summit in New York the previous week, when the Obama administration committed to greenhouse gas emissions cuts to be included in a treaty expected to be signed in Paris in 2015. The Paris negotiations will be known as COP 21, or the 21st Conference of the Parties to the UN Framework Convention on Climate Change.
BusinessGreen -- Latest Energy and Climate Outlook predicts world on track for temperature increases of 3.3C to 5.6C this century, presenting huge challenge to global economy
by BusinessGreen staff
MIT has added its voice to the cacophony of scientific institutions presenting warnings on the true scale of projected climate impacts, with the publication of a new report arguing we are currently on track to far exceed the 2C temperature goal set by the international community.
The 2014 Energy and Climate Outlook, published earlier this week, predicts that based on current emission reduction commitments the world is likely to see temperature increases of 3.3C to 5.6C by the end of the century, well above the 2C mark that scientists have warned could trigger "dangerous" levels of irreversible climate change.
"Our world is rapidly changing," said John Reilly, co-director of the MIT Joint Program and a coauthor of the report, in a statement. "We need to understand the nature of the risks we're facing so we can prepare for them."
The report also modelled scenarios where world leaders agree a deal at next year's Paris Summit to curb emissions, but it warned that even with ambitious new commitments to curb emissions post 2020 the world was still likely to release enough greenhouse gases into the atmosphere by 2040 to make it unlikely that the 2C goal will be met.
"There is some uncertainty associated with these estimates," said Erwan Monier, a research scientist at the Joint Program and a coauthor of the report, in a statement. "The fact is that there is uncertainty about future emissions, and also in the climate's response to those emissions. Yet, it is clear that we are not meeting the 2C target based on current efforts alone."
In addition, the report recognises that clean technologies will make "some headway", but it predicts the global energy system will continue to be dominated by fossil fuels in the coming decades as global energy use doubles by 2050.
"Population and economic growth are key drivers of change," said Reilly. "Developing countries like China and India are growing fast, and will play a big role in future emissions. They're also facing the unique challenge of trying to plan for this growth under a changing climate."
The report highlights the scale of the climate adaptation challenge faced by political and business leaders, and warns that disruption to water supplies could present a particularly acute risk to future economic development.
It predicts that rising temperatures will lead to a net increase in freshwater supplies of around 15 per cent this century as the hydrological cycle accelerates. But it also expects global water demand to increase 19 per cent, leading to increased water stress.
In addition, it predicts that higher temperatures could lead to significant changes in the distribution of precipitation and the timing of rainy seasons, posing a threat to growing seasons.
"These pressures on water will mean increased focus on making sure there is enough water where and when it is needed," said Charles Fant, a postdoctoral associate at the Joint Program and a coauthor of the report. "This can be done by transporting water to where it is needed, building more storage, or conservation and efficiency efforts."
The report came as the UK's Met Office this week confirmed that it expects this September to by the driest since records began in 1910, with exceptionally low rainfall for many parts of the country. It is also likely to finish in the top five warmest Septembers on record, with UK mean temperatures significantly above the monthly average.
John Reilly at Polytechnique Montréal. Can renewables become the dominant source of electricity in Canada and the USA?

An article published this week on the University of Nottingham Climate Policy Institute Blog: "China: Local incentives drive action on global climate change".
You can find the full article by following the link below:
http://blogs.nottingham.ac.uk/chinapolicyinstitute/2014/09/18/china-loc…;
Written by Da Zhang, Valerie J. Karplus and Zhang Xiliang.
As countries ponder post-2020 action to halt global climate change, China has emerged as a more determined and prepared contributor. Why? The need to address climate change is closely linked to urgent domestic priorities such as cleaning up the air and steering the economy toward a path of sustainable growth. Environmental action is no longer a luxury but an imperative for China’s citizens and policymakers, who recently declared war on the haze and smog they frequently wake up to. And because the severe air pollution problem and climate change share some common roots—burning coal and other fossil fuels—carefully planned countermeasures will address both. Recent policies enacted to address air quality combined with anticipated market-based approaches for enforcing future caps on emissions and pollution will deliver cuts in GHG emissions that could enable China to take a more ambitious position in post-2020 climate talks.
China’s leaders already take their international commitments on climate change very seriously. The country is on track to meet its Copenhagen commitment to reduce the carbon intensity (CO2 emission divided by GDP) by 40–45% in 2020, relative to 2005 levels. The carbon intensity reduction over the Eleventh Five-Year Plan (2005–2010) was 21%, and the 17% reduction targeted during the Twelfth Five-Year Plan (2011–2015) is considered achievable. A 16% reduction for the Thirteenth Five-Year Plan (2016–2020) will guarantee that China hits the higher end of its original commitment. However, post-2020 there are still huge uncertainties related to China’s future growth, technological improvement, and most importantly, policy stringency that will influence the shape of China’s emissions trajectory.
In recent research, we take a closer look at the impact of existing and proposed policy measures on China’s future emissions trajectory. These measures include carbon pricing through an emissions trading system, a fossil fuel resource tax, a feed-in-tariff (FIT) for renewable electricity, hydro and nuclear capacity expansion according to government plans, and additional policies included in the National Air Pollution Action Plan (e.g. reducing the share of coal in primary energy below 65% by 2017 by implementing higher resource taxes or caps on coal use). We design two scenarios — Continued Effort (CE) and Accelerated Effort (AE) representing the existing policies and more aggressive efforts respectively and simulate them using an energy-economic modeling tool we developed to study the impacts of energy and climate policy in China. We find that China’s emissions will peak around 2040 with current effort (CE scenario) and around 2030 with strong action (AE scenario). Coal use peaks earlier than CO2 around 2020 and declines very gradually through 2050 in both policy scenarios. Of all the policies included in the package, the carbon price does the heavy lifting—and because coal is the main fuel displaced the carbon price has huge co-benefits in terms of air quality improvement. The economic impact of these policies constitutes less than 1% of total consumption in 2030, which is both very modest and in line with broader efforts to transition to slower, more sustainable economic growth. Our results suggest that introducing a national cap and price on emissions starting with the Thirteenth Five-Year Plan (2016–2020) offers an opportunity for China to transition to a cleaner growth path in line with domestic and global environmental policy goals.
China is currently laying the foundation for such an approach known as an emissions trading system (ETS). The government is considering an ETS in order to minimize the costs of reducing carbon emissions while treating of equity issues through the initial allocation of emissions allowances. By mid-2014, all seven planned pilot-scale ETS programs had been launched in several provinces and cities, and five of them have already completed the compliance cycle for the first year, which has been viewed overall as smooth and successful. As the world second largest ETS after EU-ETS, these ETS pilots offer important lessons for the future expansion of the system to a full-fledged national scale. The ETS pilot designs are as varied as the seven areas they cover. Tailored to the circumstances of the pilot area, the designs include different demographics, priorities and industries. Chinese policy makers believe this process of experimentation will allow the local communities to tailor the ETS to meet their diverse needs as heterogeneity within Chinese provinces is even more significant than that among the member states involved in EU-ETS. A remaining question is how these diverse designs can be linked and coordinated under a national ETS.
Compared to the decade or so required for the development of the EU-ETS, Chinese plans to build a national ETS by 2020 that covers most polluting sectors are ambitious. Better coordination between central and provincial governments as well as among the multiple agencies that are involved in energy and climate policy making is needed to help identify interactions between policies and avoid redundancies. There is also a strong need to develop legislation that sets penalties for exceeding CO2 limits and enhances the transparency and independent reporting of carbon emissions. Capacity building at the local and national levels to train agencies to monitor, report and verify data will also benefit from more time to observe outcomes and incorporate lessons from existing ETS.
Looking ahead to the Paris conference next year, it is fair to expect a more determined and prepared China to take a more active role. However, we should not expect to see any miracles—China is still a developing country and any pledges to reduce emissions will be underpinned by—and not at odds with—its domestic agenda. The country still has a long way to go. Overseas support for technology transfer, knowledge sharing, and personnel training—especially as it relates to the construction and operation of an effective national ETS—will be crucial to build strong institutions that can support a low carbon transition within China’s economy without undermining economic growth. China’s readiness to consider emissions limits and market-based approaches to enforcing them should be both welcomed and supported by the global community.
Da Zhang is a postdoc in the MIT Joint Program on the Science and Policy of Global Change; Valerie J. Karplus is an Assistant Professor at the MIT Sloan School of Management; Zhang Xiliang is a Professor at the Institute of Energy, Environment and Economy in Tsinghua University.
MIT's Prof. Noelle Selin appeared on CBC's The Exchange with Amanda Lang to discuss the findings of a study recently published in Nature Climate Change. Watch the interview below.
What is the observational evidence that the ocean has warmed in recent years, and how difficult is it to quantify? Oceans at MIT asks Carl Wunsch about the limits of our knowledge.
Genevieve Wanucha
Oceans at MIT
Carl Wunsch (MIT PhD ’67), Cecil and Ida Green Professor Emeritus of Physical Oceanography at MIT, has spent an entire career investigating the ocean’s role in climate, from both observational and theoretical angles. Early in his career, he spent many months working at sea. He helped organize the World Ocean Circulation Experiment, which collected the most comprehensive data set from the global ocean, and chaired the science committees leading to the flight of altimetric satellites. He has provided analysis of the oceanic general circulation and its climate influences. Mathematical methods, such as inverse theory and state estimation, form his understanding of ocean circulation and climate.
Because the ocean has an enormous ability to absorb heat from the atmosphere, it’s only logical that the ocean has warmed, and will continue to warm, as increasing amounts of greenhouse gases trap heat in the atmosphere. But what is the observational evidence that the ocean has warmed in recent years and how difficult is it to quantify? Oceans at MIT asked Wunsch about the limits of our knowledge.
1. Is there evidence that the ocean has been warming?
Overall, the ocean does appear to have warmed over the last 20 years when, relatively speaking, there are enough data to do a reasonably accurate calculation. These recent observations come from Argo floats, altimetric satellite measurements, measurements made using elephant seals tagged with instruments that monitor ocean conditions, the World Ocean Circulation Experiment (WOCE) era and follow-up repeated high resolution shipboard data, and better meteorological estimates. Before 20 years ago, so few data exist that calculations remain highly uncertain.
It’s plausible that modern ocean temperature changes are proceeding faster than earlier in the Holocene Epoch (a relatively warm period in Earth’s history that began about 11,750 years ago at the close of the last major ice age), but that signal would be lost from the record if it had been present. Paleoceanographic data, which come from “proxies” such as planktonic shell measurements of oxygen isotope ratios, are very interesting sources of information about ocean temperatures thousands of years ago, but (A), they are so sparse that no one can compute an accurate global average, and (B) interpretation of these data means that the conversion to temperature makes the numerical values very uncertain. Furthermore, the time-spacing of those data that do exist make it almost impossible to detect rapid time changes in temperature. It’s a different problem altogether from the modern one.
2. You and MIT physical oceanographer Patrick Heimbach recently published a paper in the Journal of Physical Oceanography on the mathematical modeling of the temperature changes in the deep ocean. You found that parts of the ocean actually cooled in your model. What mechanism could be responsible for the cooling?
We estimated the change in heat content of the ocean over a 20-year period using all of the many different kinds of data that are available in the interval from 1992-2011. Overall, we estimated that the ocean warmed over the past 20 years. The year-to-year variations in any given region are very large, sometimes warming, sometimes cooling, making it hard to compute an accurate average top-to-bottom. Over the 20 years, parts of the ocean appear to have cooled somewhat—despite the fact that on average we found a net warming. No contradiction exists because the ocean can take a long time to respond to heating and cooling, and parts of it are likely just beginning to change owing to atmospheric conditions from hundreds of years ago.
An analogue is the way a large house responds to outside air temperatures: if the outside temperatures go up, some parts of the house will tend to heat up quickly, particularly if the sun shines directly through the windows. Other rooms may take hours or days to start to warm. If there is a deep basement, that might stay cool for weeks despite the rest of the house having warmed up, even when the attic is stifling. When the outside temperatures drop, parts of the house may still be warming up even as the more responsive rooms have started to cool down again. The ocean has many “rooms,” many far removed from where the sun is directly shining.
3. Do you believe that the observed warming is due to anthropogenic forcing from greenhouse gases?
That seems very likely—based upon some simple physical principles. If you add greenhouse gases to the atmosphere, it will warm up, and there is then a very powerful tendency for the ocean to warm as well, more slowly. Think of the house analogy again: if I turn on a heater in one room it’s difficult to see why the adjoining rooms would not slowly warm up, and then the rooms next to them, etc. If the heated room were perfectly insulated, that wouldn’t happen, but there’s no such thing as perfect insulation, and the ocean has no analogue of that anyway.
We know the atmosphere has warmed, although exactly how much and where is subject to some uncertainty, and so the most reasonable inference is that the ocean did too–although again, exactly where, and by how much, is a serious research question. If the atmosphere is in a state to warm the ocean, everyone would agree that the upper ocean will warm first. But, there are a lot of ifs and buts. If there were a natural warming of the atmosphere, maybe because cloud cover changed, the upper ocean would also warm first. So how does that tell you if the cause is natural or artificial? Also, the upper ocean exchanges water with the deeper ocean. One question we must consider is whether that exchange is leading to a warming or cooling of the upper ocean.

Study finds big snowstorms will still occur in the Northern Hemisphere following global warming.