News Releases
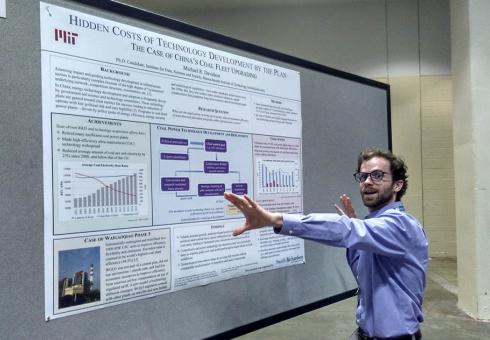
Poster highlights hidden costs in China’s coal plant upgrade
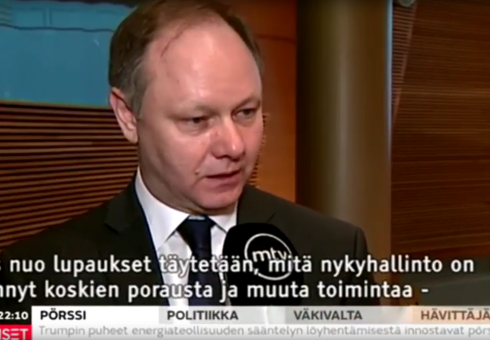
Sergey Paltsev delivers keynote address at energy policy seminar in Helsinki, draws evening news coverage

As new administration takes office, Joint Program IAP courses explore what’s at stake
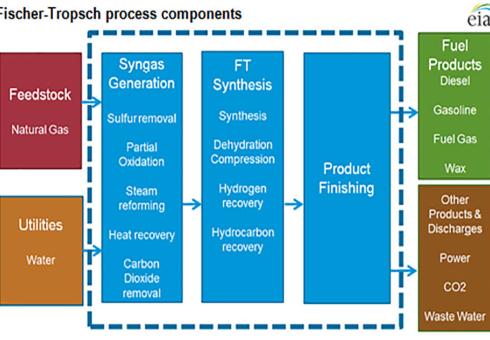
Study assesses profitability and impact on the transportation sector
New toolset evaluates economic impacts of ozone reduction policies for nine income groups

Emulators provide reliable, more computationally efficient alternative to globally gridded crop models

Study assesses impact of fire aerosols on visibility and air quality in Southeast Asia
New website showcases the MIT Joint Program’s expanded research portfolio

New technique predicts frequency of heavy precipitation with global warming

Energy scenarios provide useful decision-support tool for policymakers and investors