
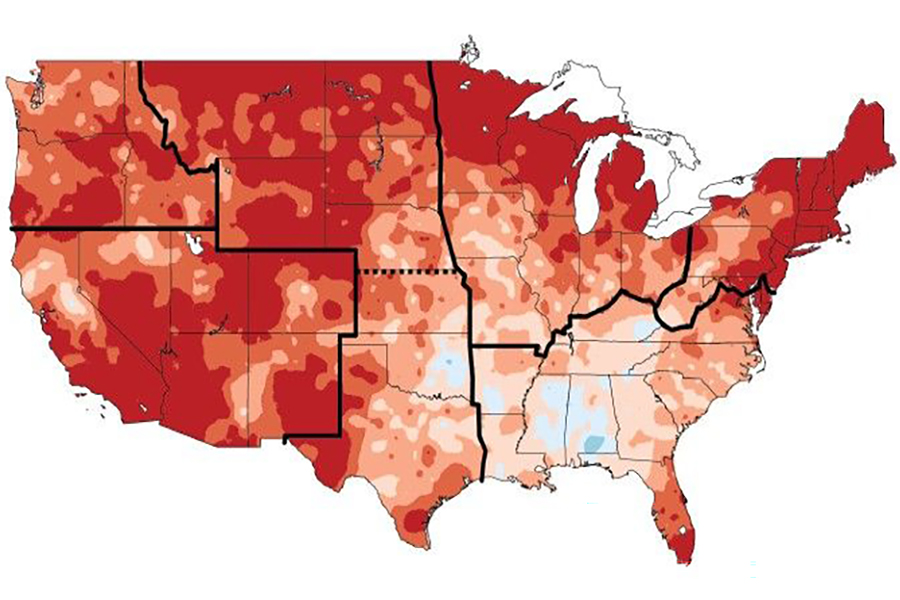
A new study reports global-warming-attributed trends in monthly-averaged maximum daily temperature for every U.S. state. (Source: NASA)
MIT CS3 Study pinpoints states with steepest warming trends
Findings indicate where adaptive measures are needed most
Global warming, the observed increase in the Earth’s average global surface temperature since pre-industrial (1850-1900) times, currently stands at around 1.63 degrees Celsius. While this number is expected to continue to rise, local temperatures will not go up uniformly around the world. In regions where warming trends are most pronounced, local adaptation and resilience measures will be especially critical to minimizing risks to ecosystems, agricultural productivity, the built environment, human health and economic well-being.
To that end, a new study in the journal Scientific Data identifies the highest-risk regions for warming within the United States. Using data from well-known, high-resolution climate and weather datasets (MERRA2 and ERA5) covering the years 1980-2022, researchers at the MIT Center for Sustainability Science and Strategy (CS3) report global warming-attributed trends in monthly-averaged maximum daily temperature for every U.S. state.
The study finds that Alaska, Utah, New Mexico, Colorado and Nevada have experienced the strongest average warming trends; the lowest occurred in Hawaii, Montana, North Dakota, South Dakota and Arkansas. Across the country, warming trends were most pronounced during the summer and fall, particularly in September and November. Alaska has the highest historical maximum daily temperature warming (an average of 2.5°C of monthly-averaged maximum daily temperature increase per degree of global warming), while Hawaii has the lowest average historical warming, at 0.8°C.
The authors expect that barring unforeseen local anomalies, these state-by-state temperature trends will continue unabated as ongoing global emissions from human activities continue to raise the average global temperature.
“Based on these results, we encourage decision-makers to assess states that have undergone the steepest increases in maximum and minimum daily temperatures, and identify where continued trends would indicate a rapid progression toward thresholds beyond which natural and managed resources, ecosystems, and infrastructure can function safely,” says MIT CS3 Deputy Director C. Adam Schlosser, a co-author of the study. “In such cases, triaging and adaptive measures would take a high priority. By directing resources to where they are needed most, state and regional planners could significantly reduce climate-related physical and financial risks.”
Unlike previous efforts to report temperature trends across the U.S., this study aggregates average maximum, minimum and mean daily temperature data at the state level for each month of the year, providing actionable information for planners in government, industry and civil society.