
News + Media
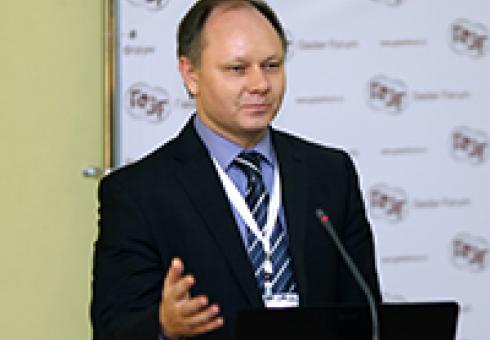
Sergey Paltsev, assistant director for economic research at the MIT Joint Program on the Science and Policy of Global Change, presented at the 2014 Gaidar Forum entitled "Russia and the World: Sustainable Development."
The expert discussion “Green growth” and sustainable development” was dedicated to such topics as energy efficiency and renewable energy as the drivers of economic growthas economic growth drivers. Besides it focused on the perspectives of “the third industrial revolution”, which is not a new idea, however it opens the prospects for efficient energy use.
Oleg Lugovoy, Research Advisor, Center for Economic Modeling of Energy and Environment, RANEPA, Jeffrey Sachs, Director of the Earth Institute and Professor of Columbia University, Hillard Huntington, Executive Director of Energy Modeling Forum, Stanford University, Emmanuel Guérin, Associate Director of Sustainable Development Solutions Network (SDSN), Frederic Vidal, President of Université de Nice Sophia-Antipolis, Sergey Paltsev, Assistant Director for Economic Research of MIT Joint Program on the Science and Policy of Global Change of the Massachusetts Institute of Technology, John Laitner, Resource Economist and Independent Consultant of Economic and Human Dimensions Research Associates and Glen Peters, Senior Research Fellow of the Center for International Climate and Environmental Research of Norway, took part in the discussion.
In his opening remarks, the moderator Oleg Lugovoy defined the vector of the discussion: “It’s a discussion on how to achieve high growth rates and improve life quality without causing harm to the environment.” He also noted that the problem could not be solved by the efforts of business and public organizations alone, but depends on economic regulation.
John Laitner turned the participants’ attention to the task of increasing the quality of energy efficiency giving USA as an example, where 86% of all energy is spent to no purpose. Inefficient use of energy leads to huge costs and is a factor limiting, in Russia as well, the potential for economic development. The expert underlined that the idea of the third industrial revolution which consists of combination of interactive communications and new green technologies is getting more important.
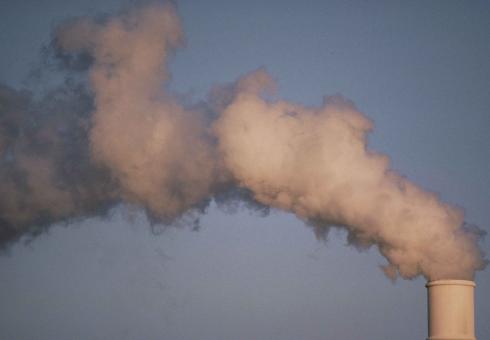
Jeffrey Sachs reminded the participants of the discussion about the idea of a prominent Russian economist Nikolai Kondratyev on periodic economic cycles (waves) linking it to the concept of a shift in technological modes. Each of them had limited resources, but never before has the scale of economic activity been so impressive and the number of population so huge (7.2 billion people). “90 trillion dollars – this is the volume of the annual economic output,” Jeffrey Sachs noted, “and this figure tends to grow progressively. So do the CO2 emissions as well. Already today 38 billion tons of СО2 are annually emitted into the Earth’s atmosphere,” the expert noted.
However, changing the energy system profoundly and substantially over 40-50 years is quite a challenge. One of the possible solutions is to switch to alternative types of fuel or renewable energy sources. Nuclear energy, if it is safe, also has a high potential. But the most important thing, according to the expert, is to reduce coal consumption, in particular, “convince China, the country which consumes this fuel in huge volumes, to do so.”
The report by Hillard Huntington marked a turn in the discussion to the subject of shale gas. The expert noted numerous uncertainties pertaining to shale gas extraction. It is still difficult to evaluate the outlook for price policy in this field unambiguously, which is caused not only by the way it is extracted, but also the volumes of gas supply.
Sergey Paltsev agreed with his colleague. He immediately dotted the i’s noting the “platitude” of shale gas: “It does not differ from the common methane, the difference lies in the method of extraction which consists in subsurface fracture.” Answering the question “whether Gazprom has overslept shale gas revolution or not”, the expert agreed with the estimation given by the Prime Minister of the Russian Federation Dmitry Medvedev who said that “this question is quite complicated.” “Gazprom has enough gas and it can go without shale gas, given proper investment and price policy,” Mr. Paltsev summarized. He also noted that the consequences of fraction are difficult to predict. Besides, the use of huge amount of water during extraction makes its benefits ambiguous, at the same time CO2 emissions from the use of natural gas are far from zero, therefore it is impossible to say that its production can address the problem of emissions globally.

In many public discussions of climate change, science takes a back seat to political agendas and rhetoric. But 12.340x (Global Warming Science), a new massive open online course from MITx now open for enrollment on the edX platform, aims to change that dynamic by providing a solid scientific view of what is really happening with global warming.
“We are trying to bring back some of the intellectual excitement that belongs to the field,” says Professor Kerry Emanuel, a co-teacher of the course whose research focuses on hurricanes. “This is a serious science course.”
The MITx course will use many of the lecture materials developed for the on-campus version of the course, along with new videos and visuals. The course will also include new exercises, problem sets, and a final exam, all tailored to the assessment tools available on the edX platform and developed with an eye on preserving the rigor of the course. “You have to have a background in mathematics up through differential equations, and a background in physics,” says Emanuel, the Cecil and Ida Green Professor of Atmospheric Science. “Our intent is that it will be as challenging as the classroom course.”
12.340x will also bring simulations used in the MIT residential course to a wider audience, including the single-column model simulation. Emanuel describes this unique tool as “a computer climate model that takes inputs such as solar radiation and atmospheric greenhouse gas content and calculates the temperatures of the surface and atmosphere, and the moisture and cloud distributions in the atmosphere. Students can change the intensity of sunlight, the time of year, the greenhouse gas concentrations, and other inputs to see how they affect climate change.”
Emanuel expects a wide range of people to take 12.340x. “You’re going to find a lot of students in climate and energy. They will want to know the physics, chemistry, and biology (of climate change).” He also expects professionals working in energy and public policy to be interested in the course. Even a politician has expressed interest in 12.340x, but Emanuel is keeping the individual’s name confidential.
Emanuel and the Department of Earth, Atmospheric and Planetary Sciences also hope to change the dynamic around the study of climate change on the MIT campus. In part because the course is not a requirement, and in part because of the perception among students that climate-change study is mostly about politics and not hard science, the on-campus course has not seen the enrollment levels Emanuel would like to see. “Part of the problem is all the publicity of global warming has sent out a message that global warming is highly politicized, and has nothing to do with science,” he says. “Nothing could be further from the truth.”
Almost 100% of climate scientists now say global warming is caused by human behavior and that action now is a moral imperative for future generations. But public perception is moving the other way, with fewer Americans worried, despite recent extreme weather conditions here and around the world. Meanwhile, new oil and gas discoveries, along with new technologies, have created the prospect of energy independence for the US, and the Obama Administration has adopted a policy called "all of the above," supporting fossil fuels as well as renewables.
John Reilly speaks with Warren Olney about the "clear and present danger" of climate change.
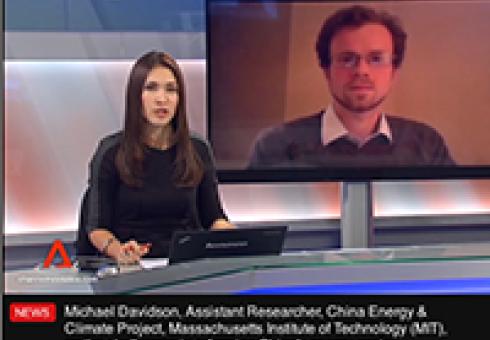
Channel News Asia interviews Michael Davidson on the Business Central show. Michael Davidson is Research Assistant for the China Energy and Climate Project and a doctoral student in the Engineering Systems Division.
Alli Gold Roberts
MIT Joint Program on the Science and Policy of Global Change
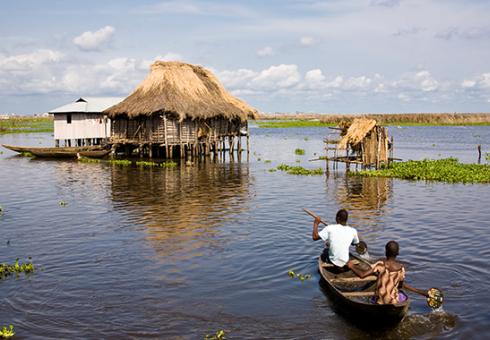
Population growth and increasing social pressures on global water resources have required communities around the globe to focus on the future of water availability. Global climate change is expected to further exacerbate the demands on water-stressed regions. In an effort to assess future water demands and the impacts of climate change, MIT researchers have used a new modeling tool to calculate the ability of global water resources to meet water needs through 2050.
The researchers expect 5 billion (52 percent) of the world’s projected 9.7 billion people to live in water-stressed areas by 2050. They also expect about 1 billion more people to be living in areas where water demand exceeds surface-water supply. A large portion of these regions already face water stress—most notably India, Northern Africa and the Middle East.
The study applies the MIT Integrated Global System Model Water Resource System (IGSM-WRS), a modeling tool with the ability to assess both changing climate and socioeconomics—allowing the researchers to isolate these two influencers. In studying the socioeconomic changes, they find population and economic growth are responsible for most of the increased water stress. Such changes will lead to an additional 1.8 billion people globally living in water-stressed regions.
“Our research highlights the substantial influence of socioeconomic growth on global water resources, potentially worsened by climate change,” says Adam Schlosser, the assistant director of science research at the Joint Program on Global Change and lead author of the study. “Developing nations are expected to face the brunt of these rising water demands, with 80 percent of this additional 1.8 billion living in developing countries.”
Looking at the influence of climate change alone, the researchers find a different result. Climate change will have a greater impact on water resources in developed countries. This is because, for instance, changes in precipitation patterns would limit water supplies needed for irrigation.
When researchers combine the climate and socioeconomic scenarios, a more complicated picture of future water resources emerges. For example, in India, researchers expect to see significant increases in precipitation, contributing to improved water supplies. However, India’s projected population growth and economic development will cause water demands to outstrip surface-water supply.
“There is a growing need for modeling and analysis like this, which takes a comprehensive approach by studying the influence of both climatic and socioeconomic changes and their effects on both supply and demand projections,” says Schlosser. “Our results underscore this need.”
The MIT team plans to continue this work by focusing on specific regions and conducting more detailed analysis of future climate changes and risks to water systems. They plan to refine and add to the model as they research other regions of the globe.
By Laura Barron-Lopez
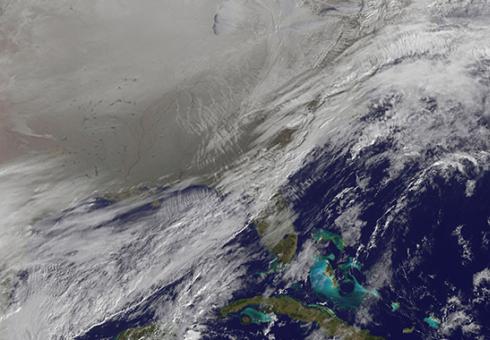
Global warming may be contributing to the "polar vortex" causing frigid temperatures across most of the nation on Monday, according to some climate change researchers.
While it seems counter-intuitive, the research argues that plunging temperatures could come from changes in the jet stream caused by climate change.
Rutgers University climate scientist Jennifer A Francis has released a number of papers about changes in the jet stream brought about by warming Arctic temperatures.
Her conclusions suggest that warming Arctic air caused by greenhouse gas emissions has caused changing to the jet stream that is pushing colder Arctic air further south, causing temperatures to plunge from the High Plains to the Deep South.
The jet stream shift has sent frigid air across the central part of the country, and deeper into the south than normal.
Alaska, meanwhile, is being hit by unusually warm conditions and California is facing record-breaking drought, Francis said.
She said the strange weather is becoming more likely because of climate change.
"We can't say that these are extremes are because of climate change but we can say that this kind of pattern is becoming more likely because of climate change," Francis said.
NASA analysis has also drawn a link between the jet stream, climate change and colder temperatures.
A 2010 NASA analysis tied colder temperatures over the course of 2009 to an event similar to the wavy jet stream, called "Arctic oscillation" — a see-sawing pressure system over the North Pole. That oscillation pushed cold air to teh south.
The NASA analysis also said that despite cold snaps, and other weather changes being a part of naturally occurring patterns, they are still in line with a "globally warming world."
According to Francis, big fluctuations in the jet stream cause extreme weather conditions to hang around longer.
She argues greenhouse gas emissions are a key factor.
"The process of warming the Arctic is intensified due to greenhouse gas emissions," Francis said. "The Arctic is warming two to three times faster than the rest of the Northern Hemisphere."
MIT atmospheric scientist Kerry Emanuel said long-term climate change can only be seen by looking at detailed statistics.
“It's certainly plausible, at lease for awhile that a changing jet stream, may cause colder winters,” Emanuel said.
But he added that it is difficult to tie a direct link between individual events like the cold snap occurring in the Midwest and East Coast to global warming.
Emanuel added that that doesn't mean you can disregard global warming.
“If you cherry pick you can always find an excuse to go against [global warming,” Emanuel said.
Image Credit: Satellite Image Shows Entry of the Polar Vortex into the Northern U.S.
Alli Gold Roberts
MIT Joint Program on the Science and Policy of Global Change
Despite global treaties and national regulations limiting toxic chemicals known as persistent organic pollutants (POPs), many of these chemicals still remain in the environment for long periods of time and accumulate in our land, water and air. These chemicals reach remote regions of the globe, like the Arctic, through air currents and have dangerous effects on humans and animals. Warming of the atmosphere and changing patterns of wind and rain, due to climate change, can affect where and when these pollutants travel. However, the impact of climate on POPs—how these patterns will change, and in what direction—is not well known.
In a new study published in Environmental Science and Technology, MIT researchers assess the impacts of both climate change and future emissions on a group of POPs called polycyclic aromatic hydrocarbons (PAHs)—toxic byproducts of burning wood, coal and oil. They are the first to address the influence of climate change on the transport of PAHs.
They find that decreases in human emissions are expected to cause PAH concentrations to decline by up to 37 percent by 2050. But, climate change can either reduce or enhance that decline depending on the physical and chemical properties of different PAHs.
“We are interested in PAHs because they continue to be released into the atmosphere and their concentrations have been increasing in Arctic marine life, in contrast to most other POPs,” says Carey Friedman, a postdoctoral associate with the MIT Joint Program on the Science and Policy of Global Change and the lead author of the study. “We find that projected decreases in human emissions will have a stronger impact on atmospheric PAH levels in the future than changes in climate.”
However, the authors find that this statement has important caveats. As temperatures rise, due to climate change, more volatile PAHs that are currently deposited in soil and vegetation are expected be emitted—actually re-emitted—into the atmosphere.
“This represents a ‘climate penalty’ for atmospheric concentrations of more volatile PAHs, meaning that emissions reductions will not be as effective as they would have been if the climate wasn’t changing,” explains Noelle Selin, co-author of the study and an assistant professor of engineering systems and atmospheric chemistry.
In contrast, atmospheric levels of non-volatile PAHs are expected to decrease under 2050 climate conditions because their ability to be deposited into the soil and land will be enhanced.
“Our results suggest that ratios of the different types of PAHs (volatile to non-volatile) in the Arctic can be used to diagnose whether the atmosphere is experiencing greater influence from climate change or reductions in human emissions,” says Friedman.
This raises the possibility that such a technique could be used to measure the effectiveness of emissions reduction activities in the context of ongoing climate change.
The study is part a series of NSF-funded research tracking how chemicals travel to remote Arctic environments and how they can be better managed. Researchers have presented the results of these studies to help inform policymakers on the most effective methods of addressing POPs like PAHs, which are affecting humans and the environment.
Read about the team’s earlier research results: http://globalchange.mit.edu/research/publications/search
Alli Gold Roberts
MIT Joint Program on the Science and Policy of Global Change
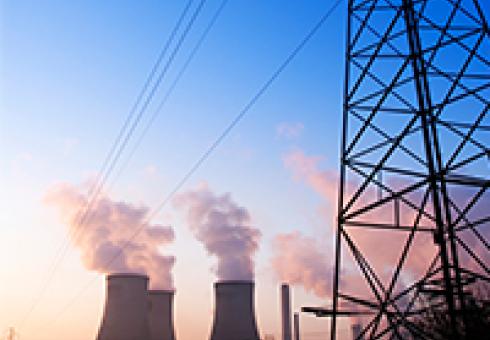
Policies to curb greenhouse gas emissions will come at a cost to energy producers, industry and consumers. Policymakers around the globe are working to determine the most effective and cost efficient way to reduce these emissions—from renewable energy subsidies and fuel efficiency standards to carbon taxes and cap-and-trade policies.
To tackle this challenge, Sergey Paltsev from MIT and Pantelis Capros from the National Technical University of Athens have come together to assess which methods and metrics are best for calculating the cost of climate policies. In their study, published this week in Climate Change Economics, they find that there is no one ideal metric for climate mitigation policies, but measuring changes in consumer welfare is one of the most appropriate techniques.
“With many of these regulations, the total costs are often less visible to consumers because the true costs are not reflected in the price of energy, but distributed to other sectors of the economy,” says Paltsev, the assistant director for economic research at the MIT Joint Program on the Science and Policy of Global Change. “The true measure of the cost of a policy is reflected in the change in consumers’ behavior, something that economists call as ‘change in welfare,’ but it is hard to convey this measure to policy makers and general public.”
In the study, the researchers compare different concepts that are used to inform the public about the cost implications of climate change. They consider two major modeling types where costs are calculated, energy system models and macroeconomic models. Energy system models focus solely on the energy sector and treat the rest of the economy as a given. Macroeconomic models represent the energy system as part of the entire economy and provide more detailed information on the various sectors. Within these approaches there are a variety of metrics used to calculate the cost of a climate mitigation policy.
After studying the cost metrics associated with each modeling approach, the researchers compared the metrics used by a team of international researchers to better understand the impacts of the current EU emissions targets (the EU Energy Modeling Forum 28 study). They find that there are large variations in cost estimates and most metrics are not directly comparable, which makes it difficult for policymakers to interpret the results of these studies.
Paltsev says there is no ideal metric for costs, but it’s clear that some approaches are more effective than others. For example, carbon prices and marginal abatement cost curves are unable to reflect the full impact of the policy on the economy. In addition, energy system models do not always take into account the full cost of a climate policy—particularly the economic impacts of policies interacting with one another. The authors recognize that depending on the objectives, other metrics and modeling techniques may be appropriate. They conclude that measuring changes in consumer welfare or consumption is an effective approach that should be used by policymakers to evaluate climate policies.
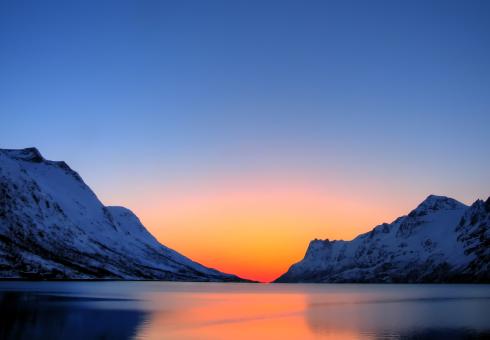
Oceans cover 97 percent of the Earth’s surface, and act as an important carbon sink. However, each part of the ocean works in different ways to take up carbon from the atmosphere and store it. Two new studies shed light on the nuances how these processes work in the Arctic Ocean and coastal zones.
The findings about the Arctic Ocean were published recently in the journal Global Biogeochemical Cycles. Stephanie Dutkiewicz, a research scientist at the Massachusetts Institute for Technology, worked with colleagues to figure out how decreasing sea ice in the summer is affecting the carbon cycle in that ocean basin from 1997-2006.
That period is in the middle a timeframe when the Arctic has been warming twice as fast as the rest of the globe, leading to major losses in sea ice, which hit a record low in 2012. Over that time, the Arctic Ocean has become a greater repository for carbon.
That’s because more open water provides more suitable habitat for phytoplankton, or algae, to grow and suck carbon dioxide out of the air. As days get shorter, the algae dies and sinks, sequestering the carbon at the bottom of the ocean.
With summer loss of sea ice and warming in the Arctic projected to continue, phytoplankton blooms are likely to be a more common occurance across the region. However, the warming trend encouraging algae growth could also have negative consequences on another ocean mechanism that removes carbon from the atmosphere.
Sunlight not only increases plant life but it also warms the surface waters of the Arctic. Dutkiewicz’s findings show that warming could eventually reduce the Arctic Ocean’s ability to absorb carbon dioxide because cold water dissolves it better than warm water.
Of course water is warming in a relative sense in the Arctic. Sea surface temperatures in the region have risen since 1965 but are still near freezing for most of the region during the summer. However, if the trend continues it could still reduce the region’s ability to take up carbon. Dutkiewicz also said the study’s findings have applications beyond the Arctic’s borders.
“The processes we’re looking at are happening everywhere,” Dutkiewicz said. “We need to be studying it (in the Arctic) and understanding the changes. That will help us understand what will happen in 20 or 50 years in other parts of other oceans.”
The other study, a review published in Nature, found that coastal oceans are also helping store carbon. Coastals oceans account for only 7 percent of the overall area of oceans, but the new study finds they play an outsize role when it comes to carbon storage.
Coastal zones weren’t always carbon sinks. Prior to the Industrial Revolution, oceans acted as net emitters of carbon. However, in the ensuing 50-100 years, a shift occurred and these areas now take up more carbon than they emit.
The new research estimates that in pre-industrial times, coastal areas emitted about 150 million metric tons of carbon a year. Presently they take up 250 million metric tons annually. That’s about equivalent to Turkey’s carbon emissions in 2008.
“Traditionally, most thinking has been that there’s a shift in biological production in recent decades, that the ocean has become more productive,” said Wei-Jun Cai, an oceanographer at the University of Delaware and author of the report. The reason, he said, is because increased runoff from agriculture finds it way down rivers and into the coastal zone, which in turn increases plant life.
However, Cai believes there’s another mechanism at play. Measurements in the open ocean of carbon dioxide in the water and the atmosphere tend to show the two stay pretty close to equilibrium. In other words, if there’s 400 parts per million of carbon dioxide in the atmosphere, a similar ratio is likely to exist in the ocean waters.
That relationship doesn’t exist in coastal areas, though. Cai recalled a trip to measure carbon dioxide in the water off the Georgia coast in 2005.
“It was very similar to what someone else measured in 1995,” he said about his measurements. “I was shocked as there was very little increase. The reason is the water doesn’t stay there for a long enough time so it doesn’t really accumulate the anthropogenic signal.”
Instead, water in coastal zones is constantly on the move thanks to the conveyor belt of ocean currents. Those currents eventually dive to the depth of the ocean, and could be storing the carbon down there according to Cai’s theory.
Both studies point to the need for better monitoring in both those regions. They offer tantalizing results that suggest revisiting our understanding of the globe’s carbon budget, but more data is needed to reinforce their results.
That data would not only inform a better understanding of the planet’s carbon budget, but also paint a clearer picture of how regions that have great economic and environmental importance are changing.
The Arctic Ocean has has long been known as a carbon sink, but a new study suggests that while the frigid waters do store large quantities of carbon, parts of the ocean also emit atmospheric carbon dioxide.
Researchers from MIT constructed a model to simulate the effect of sea ice loss in the Arctic, finding that as the region loses its ice, it is becoming more of a carbon sink, taking on about one additional megaton of carbon each year between 1996 and 2007. But while the Arctic is taking on more carbon, the researchers found, paradoxically, the regions where the water is warmest are actually able to store less carbon and are instead emitting carbon dioxide into the atmosphere.
While the Arctic region as a whole remains a large carbon sink, the realization that parts of the Arctic are carbon emitters paints a more complex picture of how the region is responding to global warming.
"People have suggested that the Arctic is having higher productivity, and therefore higher uptake of carbon," said Stephanie Dutkiewicz, an MIT research scientist. "What's nice about this study is, it says that's not the whole story. We've begun to pull apart the actual bits and pieces that are going on."
Dutkiewicz and her colleagues, including Mick Follows and Christopher Hill of MIT, Manfredi Manizza of the Scripps Institute of Oceanography and Dimitris Menemenlis of NASA's Jet Propulsion Laboratory, published their work in the journal Global Biogeochemical Cycles.
To model the Arctic's carbon cycle, the research team developed a model that traces the flow of carbon in the Arctic, looking for conditions that led to the ocean's storage or release of carbon. To accomplish this, the team incorporated three models, which MIT detailed in a news release:
"A physical model that integrates temperature and salinity data, along with the direction of currents in a region; a sea ice model that estimates ice growth and shrinkage from year to year; and a biogeochemistry model, which simulates the flow of nutrients and carbon, given the parameters of the other two models."
The model showed the Arctic taking on an average of 58 megatons of carbon each year, with an average increase of 1 megaton each year between 1996 and 2007. One megaton is 1 million tons.
The model confirms a long held theory: as sea ice melts, more organisms grow, leading to a larger carbon sink as the organisms store carbon.
But there was the anomaly of 2005-2007 where portions of the Arctic released more carbon than they stored. These years saw significant sea ice shrinkage, yet in certain regions, more carbon was emitted than stored. The researchers accounted for the anomaly by factoring in water temperature along with the levels of sea ice loss.
"The Arctic is special in that it's certainly a place where we see changes happening faster than anywhere else," Dutkiewicz said. "Because of that, there are bigger changes in the sea ice and biology, and therefore possibly to the carbon sink."
Jennifer Chu, MIT News Office
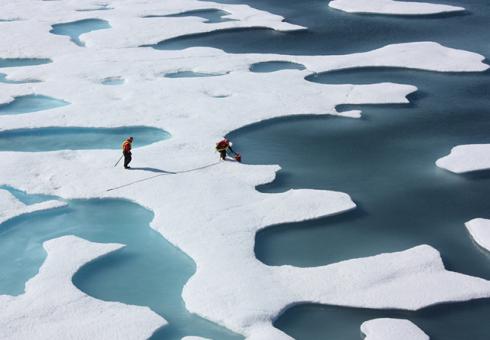
For the past three decades, as the climate has warmed, the massive plates of sea ice in the Arctic Ocean have shrunk: In 2007, scientists observed nearly 50 percent less summer ice than had been seen in 1980.
Dramatic changes in ice cover have, in turn, altered the Arctic ecosystem — particularly in summer months, when ice recedes and sunlight penetrates surface waters, spurring life to grow. Satellite images have captured large blooms of phytoplankton in Arctic regions that were once relatively unproductive. When these organisms die, a small portion of their carbon sinks to the deep ocean, creating a sink, or reservoir, of carbon.
Now researchers at MIT have found that with the loss of sea ice, the Arctic Ocean is becoming more of a carbon sink. The team modeled changes in Arctic sea ice, temperatures, currents, and flow of carbon from 1996 to 2007, and found that the amount of carbon taken up by the Arctic increased by 1 megaton each year.
But the group also observed a somewhat paradoxical effect: A few Arctic regions where waters were warmest were actually less able to store carbon. Instead, these regions — such as the Barents Sea, near Greenland — were a carbon source, emitting carbon dioxide to the atmosphere.
While the Arctic Ocean as a whole remains a carbon sink, MIT principal research scientist Stephanie Dutkiewicz says places like the Barents Sea paint a more complex picture of how the Arctic is changing with global warming.
“People have suggested that the Arctic is having higher productivity, and therefore higher uptake of carbon,” Dutkiewicz says. “What’s nice about this study is, it says that’s not the whole story. We’ve begun to pull apart the actual bits and pieces that are going on.”
A paper by Dutkiewicz and co-authors Mick Follows and Christopher Hill of MIT, Manfredi Manizza of the Scripps Institute of Oceanography, and Dimitris Menemenlis of NASA’s Jet Propulsion Laboratory is published in the journal Global Biogeochemical Cycles.
The ocean’s carbon cycle
The cycling of carbon in the oceans is relatively straightforward: As organisms like phytoplankton grow in surface waters, they absorb sunlight and carbon dioxide from the atmosphere. Through photosynthesis, carbon dioxide builds cell walls and other structures; when organisms die, some portion of the plankton sink as organic carbon to the deep ocean. Over time, bacteria eat away at the detritus, converting it back into carbon dioxide that, when stirred up by ocean currents, can escape into the atmosphere.
The MIT group developed a model to trace the flow of carbon in the Arctic, looking at conditions in which carbon was either stored or released from the ocean. To do this, the researchers combined three models: a physical model that integrates temperature and salinity data, along with the direction of currents in a region; a sea ice model that estimates ice growth and shrinkage from year to year; and a biogeochemistry model, which simulates the flow of nutrients and carbon, given the parameters of the other two models.
The researchers modeled the changing Arctic between 1996 and 2007 and found that the ocean stored, on average, about 58 megatons of carbon each year — a figure that increased by an average of 1 megaton annually over this time period.
These numbers, Dutkiewicz says, are not surprising, as the Arctic has long been known to be a carbon sink. The group’s results confirm a widely held theory: With less sea ice, more organisms grow, eventually creating a bigger carbon sink.
A new counterbalance
However, one finding from the group muddies this seemingly linear relationship. Manizza found a discrepancy between 2005 and 2007, the most severe periods of sea ice shrinkage. While the Arctic lost more ice cover in 2007 than in 2005, less carbon was taken up by the ocean in 2007 — an unexpected finding, in light of the theory that less sea ice leads to more carbon stored.
Manizza traced the discrepancy to the Greenland and Barents seas, regions of the Arctic Ocean that take in warmer waters from the Atlantic. (In warmer environments, carbon is less soluble in seawater.) Manizza observed this scenario in the Barents Sea in 2007, when warmer temperatures caused more carbon dioxide to be released than stored.
The results point to a subtle balance: An ocean’s carbon flow depends on both water temperature and biological activity. In warmer waters, carbon is more likely to be expelled into the atmosphere; in waters with more biological growth — for example, due to less sea ice — carbon is more likely to be stored in ocean organisms.
In short, while the Arctic Ocean as a whole seems to be storing more carbon than in previous years, the increase in the carbon sink may not be as large as scientists had previously thought.
“The Arctic is special in that it’s certainly a place where we see changes happening faster than anywhere else,” Dutkiewicz says. “Because of that, there are bigger changes in the sea ice and biology, and therefore possibly to the carbon sink.”
Manizza adds that while the remoteness of the Arctic makes it difficult for scientists to obtain accurate measurements, more data from this region “can both inform us about the change 
in the polar area and make our models highly reliable
for policymaking decisions.”
This research was supported by the National Science Foundation and the National Oceanic and Atmospheric Administration.