
News + Media
Four-part plan signals effort to build on last year’s climate action plan, and an end to months-long protest
David L. Chandler | MIT News Office
After months of dialog and negotiation, the student-led group Fossil Free MIT and the MIT administration have reached an agreement that has brought to an end the group’s sit-in, which began on October 22, in front of the administrative offices.
Both sides say that the new agreement (see text below) provides a positive set of plans that will help to meet the essential goals that the student group has been advocating, and will set in motion activities and structures to help ensure that MIT makes significant progress in dramatically reducing its own use of fossil fuels and in promoting serious local, national, and international goals toward reducing human impact on the Earth’s climate.
Members of Fossil Free MIT have been meeting for months with MIT’s Vice President for Research Maria Zuber, and they have identified four areas where they will work together to build on and enhance MIT’s “Plan for Action” announced last fall. Zuber, who was charged with implementing those plans, will work with the student-led group to advance these four specific goals.
The four action areas are: Moving toward campus carbon neutrality as soon as possible; establishing a climate action advisory committee to consult on the implementation of the Plan for Action; developing a set of strategies and benchmarks for MIT’s engagement with industry, government, and other institutions; and convening a forum on the ethics of the climate issue.
“For months now, I have been meeting regularly with several members of Fossil Free MIT, and I deeply admire their commitment to the cause and the honorable way they have pursued it,” said Zuber. “It is crucial that MIT seize a leadership role in addressing the urgent issue of climate change, and I believe that this agreement puts us in an even stronger position to lead effectively and successfully.”
A member of Fossil Free MIT, speaking for the group, says the group “continues to support targeted divestment of the endowment from fossil fuel companies, and we see this as complementary to industry engagement and MIT's Climate Action Plan. We're excited to keep working with the administration on areas of common ground.”
Zuber says that she, along with MIT students, faculty, staff, and alumni, are moving forward on the four basic components of this new agreement.
- For the campus carbon reduction goal reflected in the plan – a reduction of 32 percent by 2030 – there is agreement that this is to be seen as a floor, not a ceiling. The Institute will work to do everything feasible to improve on that goal, and to reinforce its stated aspiration to reach carbon neutrality as soon as possible.
- The new Climate Action Advisory Committee will be set up, including representatives of MIT undergraduate and graduate students, postdocs, faculty, staff, MIT Corporation members, and alumni. The group will be inviting all members of the MIT community to work collaboratively and bring in ideas to take advantage of this pool of talent and expertise.
- That committee will also work on developing benchmarks and guidelines on how to assess the effectiveness of MIT’s efforts to engage on climate change issues with outside institutions, including industry and government.
- Working with the whole MIT community, Zuber’s office will convene a forum to explore the issues involved in the ethical dimensions of climate change, examining the ethical responsibilities of all the different parties involved.
MIT President L. Rafael Reif praised the agreement, saying, “To the student negotiators from Fossil Free MIT and to Vice President Zuber: I am inspired by both your conduct and your results. Through respectful discussion, creative thinking, and sheer persistence, you transformed a moment of impasse into an opportunity to accelerate progress against climate change. I hope we can all join now, with renewed momentum, in the urgent work ahead.”
Below is the agreement reached by Fossil Free MIT and the MIT administration.
Shared Statement on Climate Action
March 1, 2016
Over the course of many productive conversations during the last few months, Maria Zuber, MIT’s Vice President for Research, and members of the student-led group Fossil Free MIT (FFMIT) have discussed their shared interests with respect to accelerating solutions to the urgent problem of global climate change.
The conversations arose from concerns articulated by FFMIT on three issues: the trajectory of campus carbon emissions reduction; investments in fossil fuel companies through MIT’s endowment; and the role of disinformation in hindering action in the global debate over climate change. Vice President Zuber has listened to these concerns, described some of the infrastructural challenges associated with decarbonizing campus energy generation, reinforced the senior MIT administration’s belief in a strategy of constructive engagement with industry, and reiterated its support for providing accurate, high-quality information on climate change to the public.
Based on these conversations, Vice President Zuber and FFMIT have identified four areas for building upon and enhancing MIT’s Plan for Action on Climate Change, released in October 2015. As MIT’s Vice President for Research, Professor Zuber has oversight responsibility for the plan. She and FFMIT intend to work jointly to bring these four ideas to fruition.
First, the MIT senior administration and FFMIT agree that the campus carbon emissions reduction goal included in the plan – a 32% reduction by 2030 – is a floor, not a ceiling. As MIT’s Office of Sustainability has articulated, the campus aspires to carbon neutrality as soon as possible. The Office of Sustainability, which recently published MIT’s first campus greenhouse gas inventory, has challenged the community to advance solutions to help achieve this goal, and intends to report yearly on progress.
Second, Vice President Zuber will establish and chair a climate action advisory committee to advise and consult with her on the implementation and ongoing assessment of MIT’s Plan for Action. The committee’s membership will include faculty, students, postdocs, staff, Corporation members and alumni who wish to engage in the process in an open, collaborative way, inviting implementation ideas from across the MIT community and bringing to bear the full depth and breadth of the MIT community’s talent, experience, expertise, and creativity.
Third, because a strategy of engagement with industry, government, and other institutions lies at the core of MIT’s Plan for Action on Climate Change, the new climate action advisory committee will provide advice to identify, develop, and publish engagement strategies and benchmarks. Benchmarks will include inputs and activities, such as number of meetings held, in addition to outcomes aligned with a 2°C future: for example, these may include steps taken by industry to develop and implement 2°C business strategies and to support a 2°C public policy framework. The committee will also provide advice and input on an annual report to be produced by the Office of the Vice President for Research to assess MIT’s progress in implementing the Plan for Action and engagement partners’ response to the climate challenge.
Fourth, working with students, faculty, staff, alumni and partners, Vice President Zuber willconvene a forum to explore ethical dimensions of the climate issue. The forum will seek to shed light on critical questions like the ethical responsibilities confronting all stakeholders – countries, industries, companies, shareholders, institutions, individuals, and different generations – if we are to limit the increase in average global temperatures to 2°C over pre-industrial levels, as well as the ethical dimensions of climate change communication.
Photo: Christopher Harting/AboveSummit
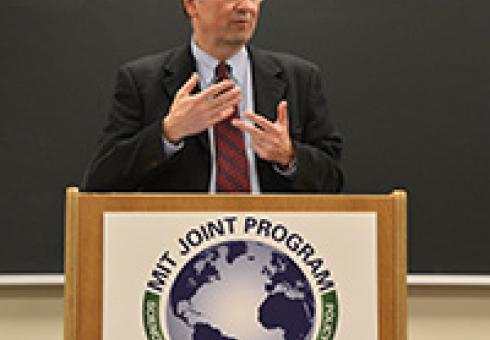
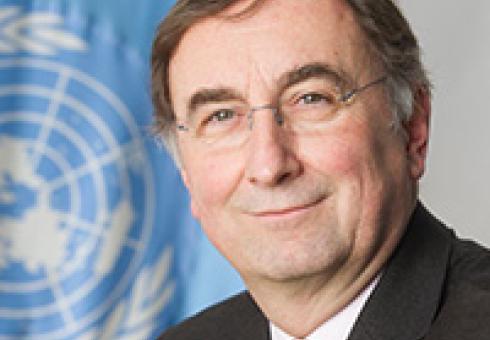
Janos Pasztor, Senior Advisor to the U.N. Secretary-General on Climate Change, describes the U.N.’s Action Agenda from its origins to its emergence at COP21 to its next steps.

Joint Program Co-Director Ronald Prinn quoted in front-page NY Times Article
“This, for me, is such a big shock,” said Prinn. “To think that you could stop measurements or throw out the people, that doesn’t make any sense to me and to many, many other people around the world.”

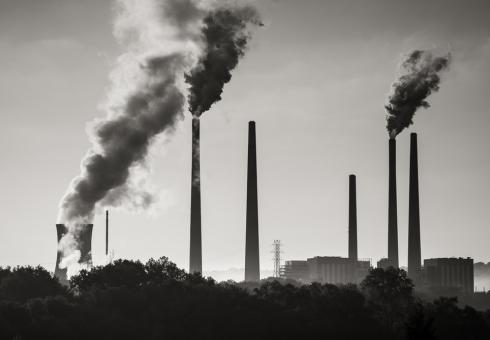
Not without a carbon tax, suggests a study by CEEPR Director Christopher Knittel
In recent years, proponents of clean energy have taken heart in the falling prices of solar and wind power, hoping they will drive an energy revolution. But a new study co-authored by an MIT professor suggests otherwise.
Professors Jake Jacoby, Valerie Karplus, Tom Malone, and John Sterman discussed their COP21 experiences on a panel moderated by MITEI Deputy Director Rob Stoner.
Noelle Selin, Amanda Giang share their perspective in The Conversation
Over 300,000 babies every year are born in the United States with levels of mercury that put them at risk of neurological and developmental problems. How much would you be willing to spend to reduce this number?
Susan Solomon co-authors study in Nature Climate Change
A large group of climate scientists has made a bracing statement in the journal Nature Climate Change, arguing that we are mistaken if we think global warming is only a matter of the next 100 years or so.