
CS3 In the Media
By Genevieve Wanucha
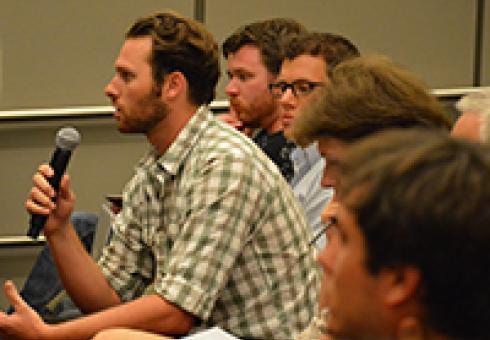
At “Debating the Future of Solar Geoengineering,” a debate hosted last week by the MIT Joint Program on the Science and Policy of Global Change, four leading thinkers in geoengineering laid out their perspectives on doctoring our atmosphere to prevent climate emergency. The evening featured Stephen Gardiner of the University of Washington, David Keith of Harvard University, Alan Robock of Rutgers University, and Daniel Schrag of Harvard University. Oliver Morton from The Economist ran the show as a deft and witty moderator.

The debate focused on the easiest, fastest, and cheapest geoengineering option on the table: solar radiation management. This technique would involve the intentional injection of sulfate aerosols into the Earth’s upper atmosphere, the stratosphere. These aerosols, the same particles released by volcanic eruptions, would reflect sunlight away from Earth, cool the planet, and, in theory, stabilize climate.
While climate modeling shows that solar radiation management would reduce risks for some people alive today, there are a number of reasons why this technique might be a bad idea, Alan Robock said. Pumping particles into the stratosphere could shift rainfall patterns and chew up the ozone layer, thus tinkering with the amount of water and UV light reaching human and ecological systems. “We are going to put the entire fate of the only planet we know that can sustain life on this one technical intervention that may go wrong?” he challenged.
Robock’s stance is what David Keith soon called “the very common, intuitive, and healthy reaction that geoengineering is ‘nuts’ and we should just get on with cutting emissions.” But Keith and Dan Shrag systematically picked the argument apart as they made the case that, even in the most optimistic of scenarios, we may not be able to solve the climate problem by acting on greenhouse gas emissions alone. For them, geoengineering is a real option.
Humans are burning enough fossil fuels to put 36 billion tons of CO2 into the air every year. And because the gas stays in the atmosphere for incredibly long time periods, we’re already committed to global warming far into the future. “Climate is going to get a lot worse before it gets better,” said Shrag. “We have to push for emissions reductions, but the world is going to put a lot more CO2 in the atmosphere, and we better figure out what to do about it.”
The debate was more nuanced than a “to geoengineer or not-to-geoengineer’ type of thing. Solar radiation management, Keith and Gardiner agreed, would not be ethical in the absence of a simultaneous reduction in CO2 emissions. As computer simulations by University of Washington researchers indicate, if we were to inject aerosols for a time, while continuing to emit carbon dioxide as usual, a sudden cessation of the technique for any reason would be disastrous. The aerosols would quickly fall to natural levels, and the planet would rapidly warm at a pace far too fast for humans, ecosystems, and crops to adapt.
“So if, as a result of decisions to implement solar engineering to reduce risks now, we do less to cut emissions and emit more than we otherwise would, then we are morally responsible for passing risk on to future generations,” said Keith.
Caveats to geoengineering continued to roll in during the Q&A. The technique would likely end up a dangerous catch-22 in the real world, according to Kyle Armour, postdoc in the MIT Department of Earth, Atmospheric and Planetary Sciences: “The case can be made that the times we would be most likely to use solar radiation management, such as in a climate emergency, are precisely the times when it would be most dangerous to do so.” In essence, implementing geoengineering to tackle unforeseen environmental disaster would entail a rushed response to a climate system we don’t understand with uncertain technology.
The post-debate reception buzzed with the general feeling that the panelists lacked enough “fire in their bellies.” “Debate? What debate?” asked Jim Anderson, Professor of Atmospheric Chemistry at Harvard. “I was expecting Italian parliament fisticuffs,” said Sarvesh Garimella, a graduate student in the MIT Department of Earth, Atmospheric and Planetary Sciences. Perhaps this was because, as several MIT graduate students noted, the debaters never touched the most fundamental research needed to evaluate the viability of geoengineering: aerosol effects on clouds.
The thing is, aerosols in the stratosphere do reflect sunlight and exert a cooling effect on Earth. “But they have to go somewhere,” said MIT’s Dan Cziczo, Associate Professor of Atmospheric Chemistry, who studies how aerosols, clouds, and solar radiation interact in Earth’s atmosphere. “Particles fall down into the troposphere where they can have many other effects on cloud formation, which have not been sorted out. They could cancel out any cooling we achieve, cool more than we anticipate, or even create warming,” Cziczo said. Indeed, the most recent Intergovernmental Panel on Climate Change (IPCC) report lists aerosol effects on clouds as the largest uncertainly in the climate system. “I don’t understand why you would attempt to undo the highly certain warming effect of greenhouse gases with the thing we are the least certain about.” For Cziczo, this is a non-starter.
The panelists largely acknowledged that we don’t understand the technique’s potential effects well enough to geoengineer today, but they have no plans to give up. Keith notes that a non-binding international memorandum laying out principles of transparency and risk assessment is needed now. And of course, vastly expanded research programs. “Before we go full scale,” said Keith as the debate came to a close, “we have to broaden far beyond the small clique of today’s geoengineering thinkers, but that doesn’t have to take decades.”
Watch the video here.

By Michael Davidson
Wind is China’s fastest growing renewable energy resource. In 2012, 13 gigawatts (GW) were added to the system, and incremental wind electricity production exceeded coal growth for the first time ever. In the same year, unused wind electricity hit record highs while wind not connected to the grid was roughly half the size of Germany’s fleet. China’s is perhaps the largest yet most inefficient wind power system in the world.
As a variable, diffuse and spatially segregated energy resource, wind has a number of disadvantages compared to centralized fossil stations. These unavoidable limitations are not unique to China, though they are magnified by its geography. In addition, as I outlined in a previous post, coal has uniquely shaped China’s power sector development and operation; these also play a role in limiting wind’s utilization. Eyeing ambitious 2020 renewable energy targets and beyond, policy-makers and grid operators are confronting a vexing decision: continue the status quo of rapidly expanding wind deployment while swallowing diminished capacity factors, or focus more on greater integration through targeted reforms.

Getting the Power to Market
Unlike other countries with varying political support for renewable energy, wind in China enjoys a privileged status. A well-funded feed-in-tariff (FIT) and other government support since 2006 encouraged an annual doubling of wind capacity for four consecutive years, followed by 10-15 GW additions thereafter. Wind projects are typically far from city and industrial centers where electricity is needed, however, and transmission investments to connect to the grid did not keep up pace. This remarkable gap left turbines – as many as a third of them in 2010 – languishing unconnected, unable to sell their electricity (see graph).

From Brazil to Germany, grid connection delays – primarily transformer and line right-of-way siting, permitting and construction – have occurred where there is rapid wind power development. China, however, had until mid-2011 a unique policy that exacerbated the wind-grid mismatch: all projects smaller than 50 MW could be approved directly by local governments, bypassing more rigorous feasibility analyses, in particular, related to grid access. The delay of central government reimbursement to overburdened local grids for construction may also be responsible. The level of non-grid connected capacity is hovering around 15 GW as of the end of 2012.
If you are a wind farm owner and have successfully connected to the grid, you might still face hurdles when trying to transmit your power to load centers. Grid operators make decisions a day ahead on which thermal plants to turn on, so if wind is significantly higher than forecasted 24 hours before, the difference may be curtailed (or “spilled”) to maintain grid stability. If wind is at the end of a congested transmission line, the grid operator may also have to curtail, as happens in ERCOT (Texas’ grid) and northwest China. Finally, to manage hourly variation, grid operators will accept wind as much as they can ramp up and down other generators to maintain supply and demand balance. The thermodynamics of fossil fuel plants place limits on this flexibility.
As with grid connection, China’s curtailment problems are much more severe than for its peers (see graph). The latest provincial figures, for 2011, pegged this at between 10~20%, and reports on 2012 show this skyrocketing to as high as 50% in some regions. By comparison, ERCOT peaked at 17% in 2009 and was 3.7% last year. This difference is largely, though not exclusively, attributable to two factors: China’s mix is coal-heavy which is more sluggish when changing output than, for example, natural gas. As I described before, the increased size of coal plants makes this effect more pronounced.

Secondly, since the Small Plant Closure Program began in 2006, new coal plants built to replace the aging fleet were preferentially designed as combined heat and power (CHP) to provide residential heating and industrial inputs where available, with the northeast seeing the highest penetration. Keeping homes warm during winter nights when wind blows the strongest effectively raises the minimum output on coal plants and reduces the space for wind. Following particularly high winter curtailment in 2012, China’s central planning agency, the National Development and Reform Commission (NDRC), began encouraging projects to divert excess wind to electric water heaters and displace some fraction of coal CHP. Given the capital investments required and the losses in conversion from electricity to heat, it is not clear how economical these pilots will be.
The Politics of Power
Besides the inflexibilities in the power grid described above, several idiosyncrasies of China’s power sector governance likely have a hand in spilled wind. A product of the partial deregulation that occurred between 1997 and 2002 was the establishment of “generation quotas” for coal plants: minimum annual generation outputs fixed by province loosely to recover costs and ensure a profit. Since China no longer has vertically integrated utilities, these are not true “cost-of-service” arrangements. There may be messy politics if wind cuts into the quotas of existing plants.
On top of this, decisions to turn on, up, down or off generators on the grid (collectively referred to as “dispatch”) are fragmented by region, province and locality (read here and here for excellent primers). To bring order to these competing demands, dispatch is fairly rigid and a set of bilateral contracts between provinces have been institutionalized stipulating how much electricity can be transmitted across boundaries. The primary reason for creating a wide, interconnected grid is the ability to flexibly smooth out generation and load over a large number of units, but this kind of optimization is nigh impossible without centralization of dispatch and transmission.
Targeted reforms could help deal with these hurdles to accommodating more wind. In fact, the guiding document for power sector reform published in 2002 (State Council [2002] No. 5) lays out many of them: establish a wholesale market in each dispatch region to encourage competition in generation; open up inter-regional electricity markets; and allow for retail price competition and direct electricity contracts between producers and large consumers, among others. Former head of the National Energy Administration and key arbiter during the reform process, Zhang Guobao, vividly recounts the heated discussions [Chinese] that led to this compromise.
Ten years later, most of the challenges are well-known: separately regulated retail and wholesale prices, a semi-regulated coal sector, and political fragmentation. Recently, there may be renewed interest in tackling these remaining reform objectives. Electricity price reform was listed in a prominent State Council document on deepening economic reforms in May, and NDRC has taken steps to rectify the coal-electricity price irregularities. Still broader changes will require strong leadership.
Managing the Unpredictable
Record curtailment in 2012 prompted a strong central government backlash: a suite of reports, policy notices and pilots soon followed. These were targeted at better implementation of existing regulations (such as a mandate that grids give precedence to renewables over thermal plants), additional requirements on wind forecasting and automated turbine control, and compensation schemes of coal generators for ramping services. These policies and central government pressure to better accommodate renewables appear to have had an impact: all provinces except Hebei saw an increase in utilization hours in the first half of 2013 [Chinese].
Due to the unique mix of power plants and regulation in China, typical wind integration approaches such as increased transmission are important but not sufficient. China aims to generate at least 390 TWh of electricity from wind in 2020, which is roughly 5% of total production under business-as-usual, over twice in percentage terms of current levels. This will put additional stresses on the nation’s purse and power grid. How China chooses to face these conflicts and grow its wind sector – through a combination of more investment and targeted reforms – will have unavoidable implications for the long-term viability of wind energy in the country.
Read Parts 1 and 2 in the "Transforming China's Grid" series: "Obstacles on the Path to a National Carbon Trading System" and "Will Coal Remain King in China’s Energy Mix?"

Four MIT students won first place in a competition by the U.S. Association of Energy Economics (USAEE) aimed at tackling today’s energy challenges and preparing solutions for policymakers and industry. The students, Ashwini Bharatkumar, Michael Craig, Daniel Cross-Call and Michael Davidson, competed against teams from other North American universities to develop a business model for a fictitious utility company in California facing uncertain electricity growth from a rise in electric vehicle charging.
“Overall, the case competition was a great opportunity to consider solutions to the very challenges that electric utilities are facing today,” says Bharatkumar.
With the goal of minimizing distribution system upgrade costs, the MIT team tested how well several business models or technology alternatives could address the utility company’s challenge. These included: implementing a real-time pricing and demand response program, using battery storage, using controlled charging, or some combination of the three.
The MIT students found that, instead of simply expanding the transmission and distribution network to accommodate the increased demand, the better course of action would be to install advanced metering infrastructure and implement controlled charging to shift the electric vehicle load to off-peak hours. They also recommended modifying the rate structure to include capacity – not just energy – costs. For example, grid users choosing to charge their vehicles during peak hours would incur an additional fee.
The team presented their recommendations at the annual USAEE and International Association for Energy Economics North American Conference in Anchorage, Alaska on July 29-31.
The MIT team’s presentation may be found here: http://www.usaee.org/usaee2013/submissions/Presentations/MIT_CaseComp_July29.ppt
Other presentations are available at: http://www.usaee.org/USAEE2013/program_concurrent.aspx
By Mark Fischetti
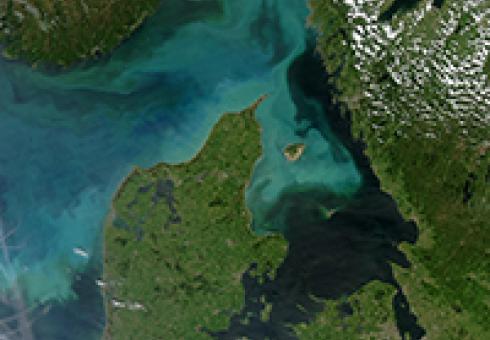
As Earth’s atmosphere warms, so does the ocean. Scientists have demonstrated how rising ocean temperatures and carbon dioxide levels can stress marine organisms. But a new model developed by the Massachusetts Institute of Technology reveals a surprising conclusion: If global temperature trends continue, by the end of this century half the population of phytoplankton that existed in any given ocean at the beginning of the century will have disappeared and been replaced by entirely new plankton species. “That’s going to have impacts up the food chain,” says Stephanie Dutkiewicz, principle research scientist at M.I.T.’s Program in Atmospheres, Oceans and Climate.
Rising temperatures will force all kinds of sea creatures to adjust. Tiny phytoplankton, a major food source for fish and other sea creatures, could perish as temperatures rise in an ocean region. Most at risk are the organisms in the coldest waters, which lack the resilience to adapt to warmer homes. In theory, the phytoplankton could evolve to alter their body chemistry or they could migrate elsewhere, perhaps closer to the poles. Either way, such immense change may leave species higher up the food chain unable to feed themselves.
The new model does not specify precisely how phytoplankton will respond or which fish populations might flourish or flounder, but it is sufficiently detailed to indicate that the new ocean conditions will likely lead to widespread replacement of the phytoplankton now in place. Dutkiewicz’s model accounts for 100 different phytoplankton species whereas most other models include just three or four. “With such finer resolution,” Dutkiewicz says, “we can see how significantly ecosystem structures will change.”
The results depict a complex picture. As the temperature rises, many phytoplankton produce more offspring. But less mixing occurs between deep cold waters and warm surface waters—a phenomenon known as stratification. Most nutrients that phytoplankton rely on well up from the deep, so less mixing means less sustenance for the microorganisms. Oceans at low latitudes—already considered the deserts of the sea—will provide even fewer nutrients for microorganisms, leaving even less food for the fish that feed on them.
At higher latitudes, Dutkiewicz says, higher temperatures and less mixing could force phytoplankton to stay closer to the surface, where at least some nutrients are available. More sunlight in that top layer, however, could again change the mix of micro critters. “There is a huge range in size and type of phytoplankton, which can affect the fish that graze on them,” she says.
Dutkiewicz is now beginning to lend additional realism to the model by adding more factors, such as changing levels of nitrogen and iron. Ocean acidification is also high on her list—a chemical variable that could alter competition among phytoplankton, some of which are far more adaptable to changing pH levels than others. Any of these dials on the dashboard could significantly affect the fate of whole ecosystems.

Keeley Rafter
Engineering Systems Division
Noelle Selin, assistant professor of engineering systems and atmospheric chemistry, along with Amanda Giang (Technology and Policy Program graduate) and Shaojie Song (Department of Earth, Atmospheric and Planetary Sciences PhD student), recently traveled aboard the specialized NCAR C-130 research aircraft as part of a mission to measure toxic pollution in the air.
The team participated in the Nitrogen, Oxidants, Mercury and Aerosol Distributions, Sources and Sinks (NOMADSS) project. The NOMADSS project integrates three studies: the Southern Oxidant and Aerosol Study (SOAS), the North American Airborne Mercury Experiment (NAAMEX) and TROPospheric HONO (TROPHONO). Selin’s group focuses on the mercury component.
“Mercury pollution is a problem across the U.S. and worldwide,” Selin says. “However, there are still many scientific uncertainties about how it travels from pollution sources to affect health and the environment.”
Selin and her students used modeling to inform decisions about where the plane should fly and to predict where they might find pollution. Their collaborators at the University of Washington aboard the aircraft captured and measured quantities of mercury in the air, conducting a detailed sampling in the most concentrated mercury source region in North America.
“It was really exciting to experience first-hand how measurements and models could support each other to address key uncertainties in mercury science,” Giang says.
The main objectives of this project include constraining emissions of mercury from major source regions in the United States and quantifying the distribution and chemical transformations of mercury in the troposphere.
NOMADSS is part of the larger Southeast Atmosphere Study (SAS), sponsored by the National Science Foundation (NSF) in collaboration with the National Oceanic and Atmospheric Administration, the U.S. Environmental Protection Agency and the Electric Power Research Institute. This summer, the Southeast Atmosphere Study brought together researchers from more than 30 universities and research institutions from across the U.S. to study tiny particles and gases in the air from the Mississippi River to the Atlantic Ocean, and from the Ohio River Valley to the Gulf of Mexico. The study aims to investigate the relationship between air chemistry and climate change, and to better understand the climate and health impacts of air pollution in the southeastern U.S.
Coal has been the primary fuel behind China's economic growth over the last decade, growing 10 percent per year and providing three quarters of the nation’s primary energy supply
By Michael Davidson
Coal has been the primary fuel behind China’s economic growth over the last decade, growing 10 percent per year and providing three quarters of the nation’s primary energy supply. Like China’s economy, coal’s use, sale and broader impacts are also dynamic, changing with technology and spurring policy interventions. Currently, China’s coal sector from mine to boiler is undergoing a massive consolidation designed to increase efficiency. Coal’s supreme position in the energy mix appears to be unassailable.
However, scratch deeper and challenges begin to surface. Increasingly visible health and environmental damages are pushing localities to cap coal use. Large power plants with greater minimum outputs are shackling an evolving power grid trying to accommodate new energy sources. Further centralization of ownership is rekindling decade-old political discussions about power sector deregulation and reform
This unique set of concerns begs the question: how long will coal remain king in China’s energy mix?
Read the rest at The Energy Collective...
This analysis is part of a new blog by MIT student Michael Davidson hosted by The Energy Collective on “Transforming China’s Grid.” Follow the blog here: http://theenergycollective.com/east-winds

New research in China quantifies the relationship between reduced life expectancy and elevated air pollution from coal fired boilers. MIT professor Michael Greenstone tells host Steve Curwood that residents in the north of China live 5 years less on average than those in the south as a result of higher exposure to air pollution from coal combustion.
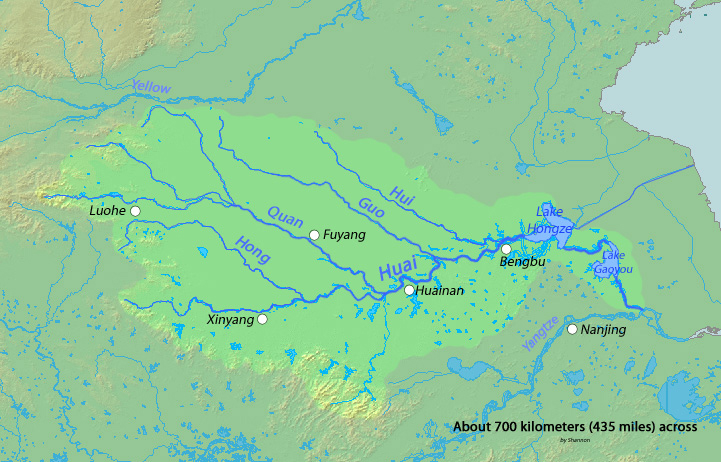
Air pollution has taken a toll on the health of Chinese residents. A person living in the north of the River Huai can expect to lives 5 years less than a person south of the river, an unintended legacy of the government’s policy to give free coal for winter heating in the north of the country. (US Embassy)
New research in China quantifies the relationship between reduced life expectancy and elevated air pollution from coal fired boilers. MIT professor Michael Greenstone tells host Steve Curwood that residents in the north of China live 5 years less on average than those in the south as a result of higher exposure to air pollution from coal combustion.
Transcript:
CURWOOD: Highly polluted air is bad for your health, and that's particularly true when it's air full of small particles from coal-fired power plants, as studies going back for years have shown. But just how bad? Now for the first time, there's a study that actually quantifies how many years of life expectancy are lost to a given amount of particulate exposure. Michael Greenstone is a Professor of Environmental Economics at MIT. He recently published a paper that compared two populations in China that experienced very different levels of polluted air.
GREENSTONE: The basis of the study comes from a Chinese policy that was implemented during the Planning Period.
CURWOOD: This was back in the 1980s we’re talking about.
GREENSTONE: It dates really from the 1950s to the 1980 period, although the legacy of the policy remains to date. But they didn’t have enough money to provide winter heating for everybody, so they somewhat arbitrarily decided that people who live north of the Huai River, which bisects the country into north and south, would have free winter heating, and that was provided through free coal and building the infrastructure to combust the coal to create heat. And the basis of the study is to compare people who live just north of the river with people who live just to the south of the river. And I should add, in the south, it was forbidden to build heating units.
So what the study did then is it got data from 1981 to 2000 on pollution, and what we find is pretty dramatic. Living north of the river led to almost 200 micrograms per cubic meter increase in total systemic particulates. Now, of course, most people aren’t familiar with those units, so to put it in context, it was about 350 micrograms per cubic meter in the south, and 550 micrograms per cubic meter in the north, and by comparison, the US average right now is probably 40 or 50. So both the levels are enormous, and the difference between the north and south is also enormous.
CURWOOD: So what did you find when you compared life expectancy for residents in the north versus the south?
GREENSTONE: It’s remarkable. So, as I mentioned, just at the river’s edge there’s a jump up in particulates concentrations, and that’s matched by a jump down in life expectancy. Specifically, what we found is people who live north of the Huai River, and were the intended beneficiaries of these policies, have life expectancy about five-and-a-half years less than people who live to the south.
CURWOOD: How many people live in that area to the north?
GREENSTONE: In north China there’s about 500 million people, and so, from that, we deduced that the policy is causing a loss of approximately 2.5 billion life years.
CURWOOD: What kind of illnesses? What kind of deaths were these people going through?
GREENSTONE: All of the effects appear to be coming from elevated mortality rates due to cardiorespiratory causes of disease that are plausibly related to air pollution. So, lung cancer, heart attacks, other respiratory diseases. In contrast, we find no affect on mortality rates associated with causes of death that are non-cardiorespiratory.
CURWOOD: Where you able to break out just how much particulate would lead to just how much lower life expectancy?
GREENSTONE: Yes. So, in particular what we find is that an extra hundred micrograms per cubic meter of total suspended particulates is associated with a loss of life expectancy of about three years. And why that’s important is that that can be applied to other settings, both in other countries, and in other parts of China as well.
CURWOOD: Now the wind can carry air pollution from China across the Pacific Ocean to North America. Should people, say, in California be concerned about air pollution from China?
GREENSTONE: There’s always a concern about that, and it would definitely be the smaller particles that would be able to travel that far. I think probably the larger concern for Americans and really everyone who lives on the planet are the increasing rates of carbon dioxide emissions coming from China, which is a completely different pollutant, but is also associated with the combustion of coal and is causing climate change.
CURWOOD: So you don’t worry so much about particulates, you worry about CO2.
GREENSTONE: Yes. I mean, it’s worth emphasizing that China consumes more than half of the world’s coal.
CURWOOD: So what policies does China have now regarding this use of free heat in the north? And what are they doing to address the obvious public health problem?
GREENSTONE: Yes, so the legacy of the policy continues. It’s not quite in the same form. I don’t think the government is running around installing boilers anymore, but they continue to subsidize coal in the north. As an example, I’ve lectured at a university in Chengdu which is a city that’s in the south but it’s in the northern part of the south so they have cold winters. And it was just normal occurrence that when I was lecturing there was no heat in the building and all the students were wearing winter coats. So the legacy of this policy continues today. With respect to policy looking forward, I think what this study has helped to highlight is that consequences of air pollution in terms of human health are greater than what had been previously realized. And perhaps it will tilt the balance as they try to devise the optimal tradeoff between air pollution and increasing incomes.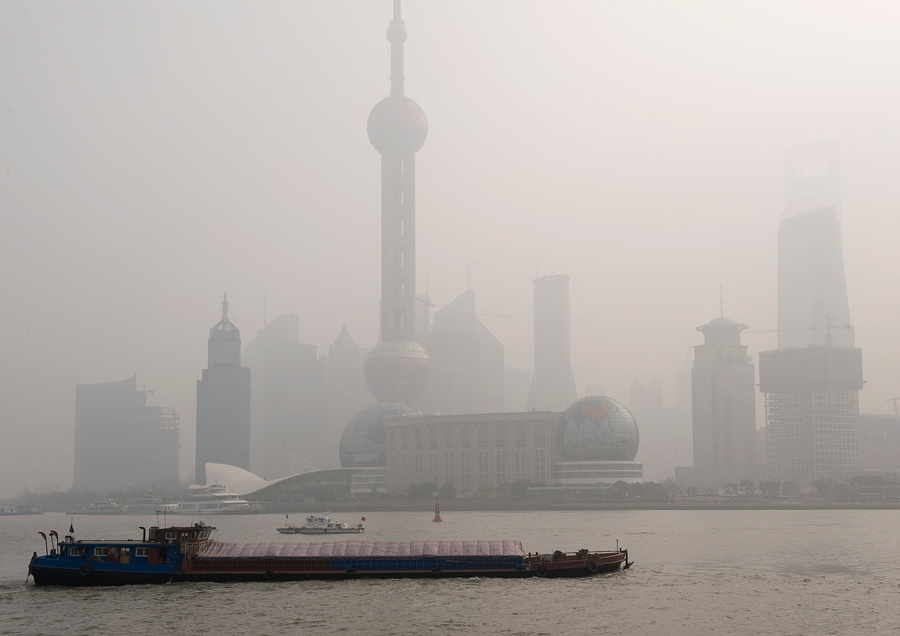
CURWOOD: What has been the response to your study in China, privately as well as publicly?
GREENSTONE: Two of my co-authors are Chinese. One of them reported that on his microblog he had 300,000 hits in the first eight hours, and that was in response to a post describing the results. I think in the coming days and months, it will be very interesting to see what the impacts are, and the degree to which it affects Chinese policy. Candidly, China has an opportunity here to greatly improve the health of its citizens.
CURWOOD: Michael Greenstone is Professor of Environmental Economics at the Massachusetts Institute of Technology. Thanks so much, Professor Greenstone.
GREENSTONE: Thank you for having me.
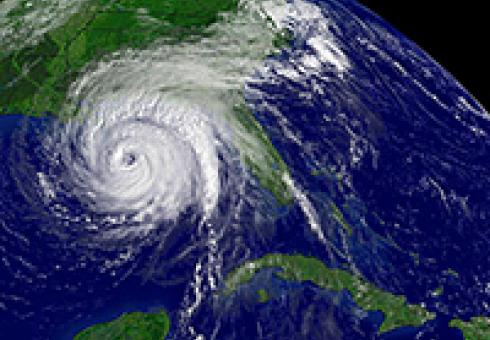
With global warming, a study finds, tropical cyclones may become more frequent and intense.
This is the first post of a multi-part series on Transforming China’s Grid, where Michael Davidson will be critically examining China’s efforts to reinvent and decarbonize its power sector and related energy goals. He begins with China’s efforts to create provincial and city-level carbon trading pilots as well as major obstacles to establishing a national system that can link with other ETS markets.
By Michael Davidson
China’s first mandatory carbon emissions trading system (ETS) pilot debuted last month before a packed auditorium in the southern city of Shenzhen. China’s first official carbon trade was greeted with fanfare and a well-choreographed script of climate officials. Shenzhen is the first of seven cities and provinces expected to unveil cap-and-trade programs in China this year, which drew skeptical reactions from foreign onlookers based on the first day’s low volume – 21,120 tons at 28-30 yuan / ton ($4.55-$5.05).
The ETS pilots are a small market-based component of a broader climate policy that has historically relied on administrative measures carried in five-year plans. The overriding priorities for provincial officials are energy and carbon intensity reduction targets, most recently allocated in 2011. Nationally, these amount to 16% and 17% reductions in energy use and carbon emissions per unit GDP, respectively, by 2015; a 40-45% carbon intensity reduction below 2005 levels by 2020. However, ensuring an early emissions peak (i.e., before 2030) will require more flexible approaches, in particular, market mechanisms, for which the ETS pilots are a useful bellwether. While the merits of the pilots should not be judged by the first trading day, significant obstacles stand in the way of creating a national ETS by 2016, as currently envisioned by the Chinese leadership. Even before the remaining six trading pilots ring the opening bell, we have a good sense of what these obstacles will be.
Read the rest on The Energy Collective...
Existing research suggests that hurricanes could become stronger but less frequent thanks to climate change. But a new study says both could happen.
(Also covered by USA Today)
By: Bryan Walsh
Maybe Mayor Michael Bloomberg would have gone through the troubling of putting together a 430-page report outlining a $19.5 billion plan to save New York from the threat of climate change had Hurricane Sandy not hit last year and inflicted some $20 billion in New York City alone. But somehow I doubt it. There’s a reason that a satellite image of Hurricane Katrina highlighted the poster for An Inconvenient Truth, or that belief in man-made global warming tends to spike after extreme weather. Heat waves are uncomfortable and drought is frightening, but it’s superstorms—combined with the more gradual effects of sea-level rise—that can make climate change seem apocalyptic. Just read Jeff Goodell’s recent piece in Rolling Stone about what a major hurricane might be able to do to Miami after a few decades of warming.
But there was one hopeful side effect to climate change, at least when it came to tropical storms. The prevailing scientific opinion—seen in this 2012 report from the Intergovernmental Panel on Climate Change—is that while tropical storms are likely to become more powerful and rainier as the climate warms, they would also become less common. Bigger bullets, slower gun.
A new study in the Proceedings of the National Academy of Sciences, however, suggest that we may not be so lucky. Kerry Emanuel, an atmospheric scientist at the Massachusetts institute of Technology (MIT) and one of the foremost experts on hurricanes and climate change, argues that tropical cyclones are likely to become both stronger and more frequent as the climate continues to warm—especially in the western North Pacific, home to some of the most heavily populated cities on the planet. But the North Atlantic—meaning the U.S. East Coast and Gulf Coast—won’t be spared either. Bigger bullets, faster gun
Emanuel is going up against the conventional wisdom and much of the published literature with this paper. But the reality is that we don’t have a very good grasp of how tropical cyclone formation or strength might change in the future. As Adam Freedman points out at Climate Central, hurricanes may be huge, but they’re still too small to be easily tracked by computer climate models, which do better on a larger scale. Emanuel embedded higher-resolution regional and local models into an overarching global framework. Emanuel’s “downscaled” model simulates the development of tropical cyclones at a resolution that will increase as the storm gets stronger. For each of the six IPCC global climate models, Emanuel simulated 600 storms every year between 1950 and 2005, then ran the model forward to 2100, using an IPCC forecast that has global carbon dioxide emissions tripling by the end of the century.
Emanuel’s simulations found that the frequency of tropical cyclones will increase by 10 to 40% by 2100. And the intensity of those storms will increase by 45% by the end of the century, with storms that actually make landfall—the ones that tend to smash—will increase by 55%. As Emanuel told LiveScience:
We see an increase, in particular, toward the middle of the century. The results surprised us, but we haven’t gotten so far as to understand why this is happening.
OK, big caveats here. Emanuel is a very well-respected climatologist, but it always takes more than a single study to overturn existing scientific opinion—especially if that opinion is itself a little wobbly. Georgia Tech climatologist Judith Curry, who falls on the more skeptical side of the scientific debate on climate change, told this to Doyle Rice of USA Today:
The conclusions from this study rely on a large number of assumptions, many of which only have limited support from theory and observations and hence are associated with substantial uncertainties. Personally, I take studies that project future tropical cyclone activity from climate models with a grain of salt.
We’ll see in the decades to come whether Emanuel is right. But in a way, it may not matter all that much. As Sandy showed, hurricanes already pose a tremendous threat to our coastal cities. And that threat will continue to grow no matter what climate change does to tropical storm frequency or intensity because we’re putting more and more people and property along the water’s edge. Remember Miami? In 1926 the city was devastated by a Category 4 hurricane. (Sandy barely ranked as a Category 1 by the time it made landfall.) The difference is that there wasn’t much of a Miami back in 1926—the city’s population had just passed 100,000. Today more than 2.5 million people call Miami-Dade county home, and a hurricane of the same sort that hit in 1926 that hit now would cause $180 billion in damages. Whatever climate change does to hurricanes, we need to be ready.
A new study links heavy air pollution from coal burning to shorter lives in northern China.
(Also covered by WSJ, WaPo, NYT, Reuters, Bloomberg, LA Times, Nat Geo, Nature, Discover, CNN, BBC, Guardian, Sky News, International Business Times, Financial Times, The Telegraph, Daily Mail, China.org)
By Lousie Watt
BEIJING (AP) — A new study links heavy air pollution from coal burning to shorter lives in northern China. Researchers estimate that the half-billion people alive there in the 1990s will live an average of 5½ years less than their southern counterparts because they breathed dirtier air.
China itself made the comparison possible: for decades, a now-discontinued government policy provided free coal for heating, but only in the colder north. Researchers found significant differences in both particle pollution of the air and life expectancy in the two regions, and said the results could be used to extrapolate the effects of such pollution on lifespans elsewhere in the world.
The study by researchers from China, Israel and the United States was published Tuesday in the Proceedings of the National Academy of Sciences.
While previous studies have found that pollution affects human health, "the deeper and ultimately more important question is the impact on life expectancy," said one of the authors, Michael Greenstone, a professor of environmental economics at Massachusetts Institute of Technology.
"This study provides a unique setting to answer the life expectancy question because the (heating) policy dramatically alters pollution concentrations for people who appear to be of otherwise identical health," Greenstone said in an email. "Further, due to the low rates of migration in China in this period, we can know people's exposure over long time periods," he said.
The policy gave free coal for fuel boilers to heat homes and offices to cities north of the Huai River, which divides China into north and south. It was in effect for much of the 1950-1980 period of central planning, and, though discontinued after 1980, it has left a legacy in the north of heavy coal burning, which releases particulate pollutants into the air that can harm human health. Researchers found no other government policies that treated China's north differently from the south.
The researchers collected data for 90 cities, from 1981 to 2000, on the annual daily average concentration of total suspended particulates. In China, those are considered to be particles that are 100 micrometers or less in diameter, emitted from sources including power stations, construction sites and vehicles.
The researchers estimated the impact on life expectancies using mortality data from 1991-2000. They found that in the north, the concentration of particulates was 184 micrograms per cubic meter — or 55 percent — higher than in the south, and life expectancies were 5.5 years lower on average across all age ranges.
The researchers said the difference in life expectancies was almost entirely due to an increased incidence of deaths classified as cardiorespiratory — those from causes that have previously been linked to air quality, including heart disease, stroke, lung cancer and respiratory illnesses.
Total suspended particulates include fine particulate matter called PM2.5 — particles with diameters of no more than 2.5 micrometers. PM2.5 is of especially great health concern because it can penetrate deep into the lungs, but the researchers lacked the data to analyze those tiny particles separately.
The authors said their research can be used to estimate the effect of total suspended particulates on other countries and time periods. Their analysis suggests that every additional 100 micrograms of particulate matter per cubic meter in the atmosphere lowers life expectancy at birth by about three years.
The study also noted that there was a large difference in particulate matter between the north and south, but not in other forms of air pollution such as sulfur dioxide and nitrous oxide.
Francesca Dominici, a professor of biostatistics at Harvard School of Public Health who has researched the health effects of fine particulate matter in the U.S., said the study was "fascinating."
China's different treatment of north and south allowed researchers to get pollution data that would be impossible in a scientific setting.
Dominici said the quasi-experimental approach was a good approximation of a randomized experiment, "especially in this situation where a randomized experiment is not possible."
She said she wasn't surprised by the findings, given China's high levels of pollution.
"In the U.S. I think it's pretty much been accepted that even small changes in PM2.5, much, much, much smaller than what they are observing in China, are affecting life expectancy," said Dominici, who was not involved in the study.