
News & Media: Earth Systems

Detailed climate simulation shows a threshold of survivability could be crossed without mitigation measures.
See article in the New York Times
David L. Chandler | MIT News Office
Within this century, parts of the Persian Gulf region could be hit with unprecedented events of deadly heat as a result of climate change, according to a study of high-resolution climate models.
The research reveals details of a business-as-usual scenario for greenhouse gas emissions, but also shows that curbing emissions could forestall these deadly temperature extremes.
The study, published today in the journal Nature Climate Change, was carried out by Elfatih Eltahir, a professor of civil and environmental engineering at MIT, and Jeremy Pal PhD ’01 at Loyola Marymount University. They conclude that conditions in the Persian Gulf region, including its shallow water and intense sun, make it “a specific regional hotspot where climate change, in absence of significant mitigation, is likely to severely impact human habitability in the future.”
Running high-resolution versions of standard climate models, Eltahir and Pal found that many major cities in the region could exceed a tipping point for human survival, even in shaded and well-ventilated spaces. Eltahir says this threshold “has, as far as we know … never been reported for any location on Earth.”
That tipping point involves a measurement called the “wet-bulb temperature” that combines temperature and humidity, reflecting conditions the human body could maintain without artificial cooling. That threshold for survival for more than six unprotected hours is 35 degrees Celsius, or about 95 degrees Fahrenheit, according to recently published research. (The equivalent number in the National Weather Service’s more commonly used “heat index” would be about 165 F.)
This limit was almost reached this summer, at the end of an extreme, weeklong heat wave in the region: On July 31, the wet-bulb temperature in Bandahr Mashrahr, Iran, hit 34.6 C — just a fraction below the threshold, for an hour or less.
But the severe danger to human health and life occurs when such temperatures are sustained for several hours, Eltahir says — which the models show would occur several times in a 30-year period toward the end of the century under the business-as-usual scenario used as a benchmark by the Intergovernmental Panel on Climate Change.
The Persian Gulf region is especially vulnerable, the researchers say, because of a combination of low elevations, clear sky, water body that increases heat absorption, and the shallowness of the Persian Gulf itself, which produces high water temperatures that lead to strong evaporation and very high humidity.
The models show that by the latter part of this century, major cities such as Doha, Qatar, Abu Dhabi, and Dubai in the United Arab Emirates, and Bandar Abbas, Iran, could exceed the 35 C threshold several times over a 30-year period. What’s more, Eltahir says, hot summer conditions that now occur once every 20 days or so “will characterize the usual summer day in the future.”
While the other side of the Arabian Peninsula, adjacent to the Red Sea, would see less extreme heat, the projections show that dangerous extremes are also likely there, reaching wet-bulb temperatures of 32 to 34 C. This could be a particular concern, the authors note, because the annual Hajj, or annual Islamic pilgrimage to Mecca — when as many as 2 million pilgrims take part in rituals that include standing outdoors for a full day of prayer — sometimes occurs during these hot months.
While many in the Persian Gulf’s wealthier states might be able to adapt to new climate extremes, poorer areas, such as Yemen, might be less able to cope with such extremes, the authors say.
Christoph Schaer, a professor of atmospheric and climate science at ETH Zurich who was not involved in this study, provided an independent commentary in the journal, writing that while deadly heat waves have occurred recently in Chicago, Russia, and Europe, in these cases infants and the elderly were most affected. The new study, Schaer writes, “concerns another category of heat waves — one that may be fatal to everybody affected, even to young and fit individuals under shaded and well-ventilated outdoor conditions.”
Schaer writes that “the new study shows that the threats to human health may be much more severe than previously thought, and may materialize already in the current century.” He told MIT News, “I think the study is of great importance, since it indicates where heat waves could get worst if climate change proceeds.”
The research was supported by the Kuwait Foundation for the Advancement of Science.
Photo: Rub' al Khali desert in the Arabian Peninsula (courtesy of Eltahir Group/MIT)
Video: Melanie Gonick/MIT
Study finds pledges by top greenhouse gas emitters leaves little room for others; urges greater R&D.
by Jennifer Chu | MIT News Office
Over two weeks in December, delegates from virtually every country in the world will gather in Paris for the 21st annual United Nations Climate Change Conference. Their ambitious goal: to hammer out a binding international agreement on climate action.
In advance of the conference, organizers have requested that countries submit Intended Nationally Determined Contributions — pledges to reduce greenhouse gas emissions, by an amount that should be “fair and ambitious,” in order to limit global warming to no more than 2 degrees Celsius above pre-industrial levels.
Now a new study by researchers at MIT and the Center for International Climate and Environmental Research in Oslo, Norway, has found that pledges by the three largest emitters — the United States, the European Union, and China — leave very little room for the rest of the world to emit.
Based on the pledges submitted, the U.S. plans to reduce emissions by 28 percent by 2025, and 83 percent by 2050, while the EU will work toward reductions of 40 percent by 2030, and 80 percent by 2050. China has not pledged a reduction, but has indicated that its emissions will peak by 2030; China also aims to improve its energy efficiency by 60 to 65 percent.
Despite these substantial commitments, the researchers found that the rest of the world’s nations would be forced to adopt per capita emissions 7 to 14 times lower than the EU, U.S., or China, by 2030, in order to keep global temperatures from rising higher than 2 C.
“The challenge of this problem is, we have about 7 billion people on the planet, and about 1 billion of us live pretty well,” says Susan Solomon, the Ellen Swallow Richards Professor of Atmospheric Chemistry and Climate Science at MIT. “The other 6 billion are struggling to develop, and if they develop using carbon as we did, the planet is going to get quite hot. And hot is, of course, just the beginning of the story in terms of what climate change actually means.”
Solomon and her colleagues have published their results in the journal Environmental Research Letters.
What’s fair?
While countries were asked to demonstrate that their pledges were fair and ambitious, conference organizers provided no framework with which to make such an assessment.
In the new study, the MIT and Norwegian scientists gauged the fairness and ambition of the top three emitters’ pledges using a “cumulative emissions” approach developed by the Fifth Assessment Report of the Intergovernmental Panel on Climate Change.
The cumulative emissions approach finds that a best estimate of 3.7 trillion tons of carbon dioxide can be emitted globally before temperatures rise 2 C above pre-industrial levels. Given the amount of carbon dioxide emitted thus far, and accounting for other greenhouse gases, land-use change, and other factors, the remaining amount is about 1 trillion tons — about 30 years’ worth of current emissions.
How to fairly allocate the remaining allowable emissions among the world’s nations is a complex and contentious issue. Solomon and her colleagues examined two scenarios for fairly reducing emissions by the EU, U.S., and China: an equity approach, which divides the global quota of emissions among all nations based on population; and an inertia approach, which divides the quota based on the current shares of global emissions.
Based on their calculations, they found all three emitters’ pledges fall short of fair: The U.S. and EU pledges may be considered in line with keeping global warming at 2 C only under the inertia scenario, in which the high emitters continue to emit based on their current shares. If, however, both were to adopt an equity scenario, they would have to pledge significantly more emissions reductions, to account for their relatively small share of the world’s population.
China’s pledge deviates significantly from both scenarios, as both would require the country to immediately begin drastic reductions. Instead, China has pledged to begin reducing its emissions in 2030, so as to improve the quality of living for its millions of citizens now living under the poverty line.
“The environment we ask for”
In sum, Solomon and her colleagues conclude that even if the three largest emitters fulfill their pledges, they would “lock the world into a higher long-term temperature increase” of around 3 C.
“People don’t realize that 2 degrees Celsius is a big change,” Solomon says. For instance, she points to the summer of 2003, in which an unprecedented hot summer killed more than 10,000 people throughout Europe.
“That summer was about 2 degrees Celsius hotter than an average European summer,” Solomon says. “By 2050, every summer in Europe will probably be 2 degrees hotter than average, if we keep going the way we’re going right now. Three degrees, in my opinion, is a really frightening change.”
To stave off additional warming, Solomon says countries will need to significantly ramp up efforts to decarbonize. In the short term, she says, international climate talks must integrate discussions on research and development, to spur technological innovation.
“We have to decarbonize the energy system via research and development, changes in technologies and policies, and we need to encourage those to happen,” Solomon says. “We’ll get the environment we ask for. History has proven time and again that public engagement is essential in making anything change on this planet.”
MIT researchers explain how technical analysis can avoid potential conflict.
CAMBRIDGE, Mass. — On the Blue Nile in Ethiopia, construction is underway on a public works project of gigantic physical proportions and exquisite political delicacy. The Grand Ethiopian Renaissance Dam, now about halfway finished, amounts to a test: With water becoming precious enough to be the stuff of war, can nations find ways to share it?
So far, so good. The project is moving toward completion, and a recent joint declaration of principles by the leaders of Egypt, Ethiopia and Sudan pledges cooperation and no “significant” downstream harm. That is critical, given that the dam will control nearly two-thirds of the water on which Egypt depends. But for the cooperation to be meaningful, these three countries will need serious technical analysis. Poor assessment of such matters as the variability of annual rainfall or minimum flows required to maintain downstream water quality could undermine a decent agreement, leading to conflict of unpredictable intensity.
That’s because the flow of the Nile is climatic roulette. It experiences periods of plentiful water and periods of extended drought, and it always has: Remember the story (in both the Bible and the Quran) of seven years of plenty, and then seven lean years? But now the stakes are much higher: Egypt’s population is 90 million, and growing. That country’s Aswan High Dam, downstream from the Ethiopian dam, helps to moderate these fluctuations, but a second large dam and its reservoir higher upriver are going to complicate things.
Egypt now receives virtually all its water from the Nile — about 60 billion cubic meters a year, slightly above the amount provided for in its treaty agreement with Sudan. That amounts to the withdrawal of 700 cubic meters per capita per year. Compare that with California, which annually withdraws about 1,400 cubic meters per capita from multiple sources, including 30 percent of the Colorado River’s annual flow, and you understand just how scarce and precious the Nile’s water is to Egypt’s welfare.
California depends heavily on Lake Powell and Lake Mead, the reservoirs behind dams on the Colorado River, which together store slightly more than three years’ worth of that river’s total flow. The new dam in Ethiopia will have an even larger storage capacity than that of Powell and Mead combined, but still amounts to just 1.5 years of the flow of the Blue Nile alone. Adding in the very large reservoir behind Egypt’s Aswan High Dam gives a storage of about 1.75 years of the total flow of the Nile. It’s not a wide margin of safety for a long drought — as Californians will attest.
The monsoon rains in Ethiopia that will feed the new dam come mainly during just three months, so by storing that water, the new dam will moderate and smooth out the flow of the Blue Nile, the 900-mile-long headstream of the Nile itself. It will also generate huge amounts of electricity, the sale of which could finance much-needed development in Ethiopia — except that transmission lines to export the power are not yet being built.
Just as California has used stored water to become an agricultural powerhouse, Sudan will benefit by using the more stable flow of water from the new dam to raise its agricultural productivity. This will allow Sudan, which sits between Ethiopia and Egypt, to finally employ its full treaty allotment of river water, which in turn will reduce what is available to Egypt.
It’s clear that a cooperative agreement among Ethiopia, Sudan and Egypt is needed to avoid conflict and downstream harm. This includes agreement on what amounts to “significant” harm, given that, in the past, Egypt has been willing to go to war to protect its water.
All three countries stand to benefit if they work together. The dam’s huge storage capacity could help both Sudan and Egypt during drought years. And if Egypt were to agree to buy the power that the new dam will generate (and to build the transmission lines to connect to it, perhaps with international help), then Ethiopia will benefit economically from stored water that has to flow downstream eventually.
Here is where the technical issues will be critical. Last November, the Abdul Latif Jameel World Water and Food Security Lab at M.I.T. convened experts on Nile Basin water resources. They pointed out that management of a river system with multiple dams required sophisticated joint management with a shared knowledge base and scientific modeling framework. The hard negotiations ahead to achieve detailed agreements on such things as reservoir operation policy, power trading, dam safety and irrigation practices will require that foreign policy and water experts from each of the three countries have a shared understanding of the technical issues and a willingness to compromise.
In May 2015, the three countries engaged technical consultants to assist with these problems, but that arrangement has since collapsed over disagreements about project management. It behooves the international community to help, through support of regional efforts like the Nile Basin Initiative, to build scientific and engineering coordination and knowledge among the three countries, provide impartial expertise, set up a management system and perhaps offer a process to resolve disputes.
The world needs to get good at sharing water, and right away. The alternative is frequent regional conflicts of unknowable proportions.
John H. Lienhard V is a professor at M.I.T. and director of the Abdul Latif Jameel World Water and Food Security Lab. Kenneth M. Strzepek is a research scientist at the M.I.T. Joint Program on the Science and Policy of Global Change.
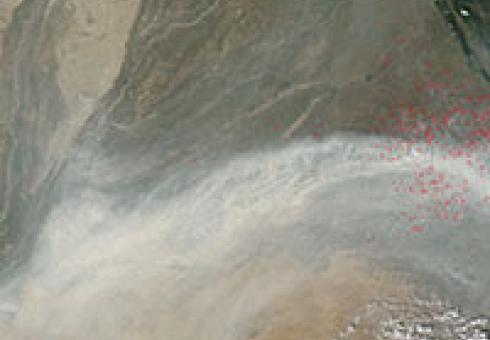
A new study describes how irrigation development modifies local and regional climate.
Kelsey Damrad | Department of Civil and Environmental Engineering
With approximately 70 percent of all freshwater consumption worldwide used for agriculture, the reliance on large-scale irrigation development continues to spread and ultimately augments crop yields in many regions.
But the ongoing expansion of cropland irrigation, just as with any human-made land-cover change, holds potential for unintended consequences. The consequences of such human activity should be well understood before being implemented.
In a new paper, an MIT team in the department of Civil and Environmental Engineering (CEE) investigates the impacts of large-scale cropland irrigation on rainfall patterns in the East African Sahel around the Gezira Irrigation Scheme, now considered one of the largest irrigation projects in the world. The researchers piloted their exploration by combining theoretical modeling analyses with observational evidence gathered over several decades since 1930 — an unprecedented approach in previous studies.
The CEE team studied 60 years' worth of data of rainfall, temperature, and river flow to empirically deduce the atmospheric impacts of irrigation development.
"Large-scale development of irrigation systems is a good example of human activity that has changed land cover and the environment significantly in many regions of the world,” says co-author Professor Elfatih Eltahir, associate department head of CEE. “In all development projects, we need to better understand the potential impacts of our actions on the environment before we mindlessly develop.”
According to the theory developed by the researchers based on their investigation, when a large area is irrigated, surface air temperature is cooled and surface pressure increased. This reaction was conjectured to reduce rainfall over the irrigated land while generating a clockwise circulation that interacts with the prevailing regional wind. Depending on that interaction, the theory predicts that specific areas of convergence would be created, which would boost the rainfall in some of the surrounding areas.
After the researchers concluded their deep analysis of regional climate data, they concurred that large-scale irrigation development in the East African Sahel has consistently enhanced rainfall in areas to the east of the irrigated lands, while reducing rainfall directly over them.
Spatially and over time, the changes in rainfall and temperature matched up in a way that exceeded the group’s expectations and almost perfectly aligned with the original theory, says co-first author of the paper and CEE postdoc Ross Alter.
"You don’t often achieve that type of clear-cut match when attributing regional climate change from both theory and observations,” Alter says.
The team’s findings, says Eltahir, are indicative of the need for further consideration of potential agricultural, hydrological, and economic repercussions from irrigation expansion.
The paper was published today in the journal Nature Geoscience, by Alter, co-first author Eun-Soon Im of the Singapore-MIT Alliance for Research and Technology (SMART), and Eltahir.
Quantifying impacts
To define a climate, one must consider a breadth of at least 30 years' worth of data. Therefore, the team studied records gathered from 1930 to 1999, with a 10-year gap for irrigation system erection, in order to quantify the environmental impacts of irrigation.
The study’s first step was to employ a complementary analysis of numerical simulations and modeling. Using a sophisticated regional climate model — developed in the Eltahir group over the past 25 years, and which represents conditions in the atmosphere as well as over land — the authors conducted simulations using both irrigated and non-irrigated settings.
Their objective, in this regard, was to enumerate the effects of the irrigated land in the Gezira Scheme on the rainfall in a theoretical sense. The researchers then verified their conjectures by comparing with real occurrences observed throughout the 60-year span of time.
When the research team cross-compared their simulations to the collected empirical evidence, the mapped depictions of the changes in rainfall from pre- to post-irrigation expansion revealed strong decreases over the Gezira Scheme and distinct increases in eastern lands. The effects of enhanced rainfall are particularly apparent in Gedaref — a region east of Gezira. For the past half-century, concurrent with the irrigation expansion in the Gezira Scheme, Gedaref has received plenty of rainfall and has emerged as a successful rain-fed agricultural region.
This climate behavior is a stark contrast to the ongoing drought experienced by the majority of the African Sahel.
To pinpoint the impacts of irrigation on climate, it is important to identify areas of relative change, not absolute change,” Alter explains. “Because rainfall in that region strongly decreased overall, any larger changes in rainfall — even zero change between the two periods in question — would still be seen as increases.” Stable rainfall, in this case, is still better in comparison to the lands experiencing droughts.
Optimizing efficiency
Though the researchers acknowledge irrigation as an ideal solution to agricultural challenges, all agree that comprehension of human-made land-cover change and its influence on the natural environment is necessary for sustainable development.
“The knowledge gained from this study provides a more fundamental understanding of the impacts of land use and land cover changes on the atmosphere,” Alter says.
The researchers specify that their study does not take into account other possible processes than irrigation development that disturb the climate such as changes in the chemical composition of the atmosphere and the resulting global climate change.
Now with an established spectrum of probable impacts from significant irrigation development, the researchers suggest that this new knowledge about the impacts of land cover change on the climate system should help in achieving more rigorous attribution of the regional and local impacts of global climate change.
“While there are many studies that show landscape has such effects, the use of real-world observed data makes this a particularly important research contribution,” says Roger Pielke Sr., a senior research scientist of the University of Colorado not involved in this study. “Irrigated landscapes worldwide, indeed all human modified landscapes, based on the Alter et al. study, should be expected to play a major role in local and regional weather and climate. This human effect on the climate system has been underestimated in past assessments of climate change. The Alter et al. paper is a very significant contribution in expanding our understanding of the human role on the climate system."
“There is undoubtedly a pressing need for large-scale irrigation in Africa and other regions,” Eltahir says. “We now have a foundation of the likely impacts of human-induced land-cover changes, and can use this new knowledge in the design stage of irrigation systems as opposed to after the fact.”
Funding for this research was provided by the Cooperative Agreement between the Masdar Institute and MIT, and by the Singapore-MIT Alliance for Research and Technology.
Mark Dwortzan
MIT Joint Program on the Science and Policy of Global Change
MIT researchers find unintended consequences
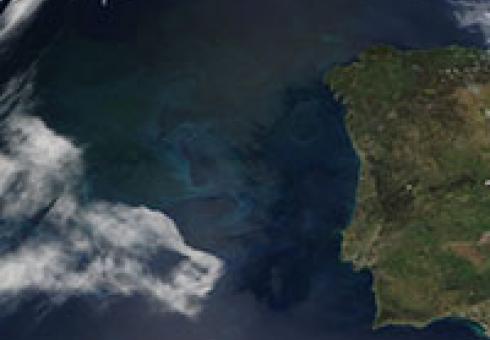
Like the leaves of New England maples, phytoplankton, the microalgae at the base of most oceanic food webs, photosynthesize when exposed to sunlight. In the process, they absorb carbon dioxide from the atmosphere, converting it to carbohydrates and oxygen. Many phytoplankton species also release dimethyl sulfide (DMS) into the atmosphere, where it forms sulfate aerosols, which can directly reflect sunlight or increase cloud cover and reflectivity, resulting in a cooling effect. The ability of phytoplankton to draw planet-warming CO2 from the atmosphere and produce aerosols that promote further cooling has made ocean fertilization—through massive dispersal of iron sulfite and other nutrients that stimulate phytoplankton growth—an attractive geoengineering method to reduce global warming.
But undesirable climate impacts could result from such a large-scale operation, which would significantly increase DMS emissions. The primary source of sulfate aerosol over much of the Earth’s surface, DMS plays a key role in the global climate system. In a study published in Nature’s Scientific Reports, MIT researchers found that enhanced DMS emissions, while offsetting greenhouse gas-induced warming across most of the world, would induce changes in rainfall patterns that could adversely impact water resources and livelihoods in some regions.
“Discussions of geoengineering are gaining ground recently, so it’s important to understand any unintended consequences,” says study co-author Chien Wang, a senior research scientist at MIT’s Center for Global Change Science and the Department of Earth, Atmospheric, and Planetary Sciences. “Our work is the first in-depth analysis of ocean fertilization that has highlighted the potential danger of impacting rainfall adversely.”
To investigate the impact of enhanced DMS emissions on global surface temperature and precipitation, the researchers used one of the global climate models that the Intergovernmental Panel on Climate Change (IPCC) uses, which simulates the evolution of and interactions among the ocean, atmosphere and land masses. Running simulations that compared two scenarios—one, known as RCP4.5, that the IPCC uses to project greenhouse gas concentrations, aerosol emissions and land use change based on policies that lead to moderate mitigation of greenhouse gas emissions over the course of the 21st century; the other identical to RCP4.5 except DMS emissions from the ocean were increased to the maximum feasible levels (about 2.5 times higher)—they found mixed results.
The simulations showed that enhanced DMS emissions would reduce the increase in average global surface temperature to half that of the RCP4.5 scenario, resulting in a net increase of 1.2° Celsius by 2100. But the cost would be a substantial reduction in precipitation for some regions.
“Generally, our results suggest that the cooling effect associated with enhanced DMS emissions would offset warming across the globe, especially in the Arctic,” says the study’s first author Benjamin Grandey, a senior postdoctoral associate in Wang’s group who configured the model simulations and analyzed the data. “Precipitation would also decline worldwide, and some parts of the world would be worse off. Europe, the Horn of Africa, and Pakistan may receive less rainfall than they have historically.”
Grandey and Wang warn that the lower rainfall could reduce water resources considerably, threatening the hydrological cycle, the environment and livelihoods in the affected regions.
The researchers hope their investigation—summarized in a video produced by Grandey—will inspire further studies of more realistic ocean fertilization scenarios, and of the potential impacts on marine ecosystems as well as human livelihoods. Further research will be needed, they say, to fully evaluate the viability of ocean fertilization as a geoengineering method to offset greenhouse gas-induced warming.
The study was funded by the Singapore National Research Foundation through the Singapore-MIT Alliance for Research and Technology Center for Environmental Sensing and Modeling, and grants from the National Science Foundation, Department of Energy, and Environmental Protection Agency.
Photo courtesy of Jacques Descloitres/NASA Goddard Space Flight Center.
Vulnerable coastal regions could face storm surges of unprecedented magnitude in the next century
Jennifer Chu | MIT News Office
"Grey swan" cyclones — extremely rare tropical storms that are impossible to anticipate from the historical record alone — will become more frequent in the next century for parts of Florida, Australia, and cities along the Persian Gulf, according to a study published today in the journal Nature Climate Change.
In contrast with events known as “black swans” — wholly unprecedented and unexpected occurrences, such as the 9/11 attacks and the 2008 financial collapse — grey swans may be anticipated by combining physical knowledge with historical data.
In the case of extreme tropical cyclones, grey swans are storms that can whip up devastating storm surges, beyond what can be foreseen from the weather record alone — but which may be anticipated using global simulations, along with historical data.
In the current paper, authors Kerry Emanuel, the Cecil and Ida Green Professor in Earth and Planetary Sciences at MIT, and Ning Lin of Princeton University simulated the risk of grey swan cyclones, and their resulting storm surges, for three vulnerable coastal regions. They found a risk of such storms for regions such as Dubai, United Arab Emirates, where tropical storms have never been recorded. In Tampa, Florida, and Cairns, Australia — places that experience fairly frequent storms — storms of unprecedented magnitude will be more likely in the next century.
“These are all locations where either no one’s anticipated a hurricane at all, such as in the Persian Gulf, or they’re simply not aware of the magnitude of disaster that could occur,” Emanuel says.
Beyond forecasts
To date, the world has yet to see a black swan or grey swan cyclone: Every hurricane that has ever occurred in recorded history could, in retrospect, have been predicted, given the previous pattern of storm activity.
“In the realm of storms, I can’t really think of an example in the last five or six decades that anybody could call a black swan,” Emanuel says. “For example, Hurricane Katrina was anticipated on the timescale of many years. Everybody knew New Orleans was going to get hammered. Katrina was not meteorologically unusual at all.”
However, as global warming is expected to significantly alter the Earth’s atmosphere and oceans in the coming decades, the track and magnitude of hurricanes may skew widely from historical patterns.
To get a sense of the frequency of grey swan cyclones in the next century, Emanuel and Lin employed a technique that Emanuel’s team developed 10 years ago, in which they embed a detailed hurricane model into a global climate model.
For this paper, the team embedded the hurricane model into six separate climate models, each of which is based on environmental data from the past, or projections for the future. For each simulation, they generated, or “seeded,” thousands of randomly distributed nascent storms, and observed which storms produced unprecedented storm surges, given environmental factors such as temperature and location.
From their simulations, the researchers observed that storm surges from grey swan cyclones could reach as high as 6 meters, 5.7 meters, and 4 meters in Tampa, Cairns, and Dubai, respectively in the current climate. By the end of the century, surges of 11 meters and 7 meters could strike Tampa and Dubai, respectively.
Changing risk
To put this in perspective, the last big hurricane to hit Tampa, in 1921, produced a devastating storm surge that measured 3 meters, or about 9 feet high.
“A storm surge of 5 meters is about 17 feet, which would put most of Tampa underwater, even before the sea level rises there,” Emanuel says. “Tampa needs to have a good evacuation plan, and I don’t know if they’re really that aware of the risks they actually face.”
Emanuel says that Dubai, and the rest of the Persian Gulf, has never experienced a hurricane in recorded history. Therefore, any hurricane, of any magnitude, would be an unprecedented event.
“Dubai is a city that’s undergone a really rapid expansion in recent years, and people who have been building it up have been completely unaware that that city might someday have a severe hurricane,” Emanuel says. “Now they may want to think about elevating buildings or houses, or building a seawall to somehow protect them, just in case.”
Upper limit shift
The team also found that as storms grow more powerful in the coming century, with climate change, the most extreme storms will become more frequent.
The team’s results show that the expected frequency for a grey swan cyclone with a 6-meter storm surge in Tampa would fall from 10,000 years today to as little as 700 years by the end of the century. Put another way, today Tampa has a one in 10,000 chance of being struck by a devastating grey swan cyclone in any given year — odds that will remain the same next week, or next year.
“Hurricanes, unlike earthquakes, are like a roll of the die,” Emanuel says. “Just because you had a big hurricane last year doesn’t make it more or less likely that you’d have a big hurricane next year.”
But in 100 years, Tampa’s odds of a 6-meter storm surge will be 14 times higher, as the world’s climate shifts.
“What that really translates to is, you’re going to see an increased frequency of the most extreme events,” Emanuel says. “Whereas the upper limit of hurricane wind speeds today might be 200 mph, 100 years from now it might be 220 mph. That means you’re going to start seeing hurricanes that you’ve never seen before.”
The group’s estimates of extreme storm intensity, while high, are not unrealistic for the coming century, says Greg Holland, senior scientist at the National Center for Atmospheric Research.
“This is an excellent example of the type of study needed to fill out our knowledge of what is possible with damaging events such as storm surge,” says Holland, who was not involved in the study. “Although the events listed are … rare, a knowledge of their possibility helps considerably with assessing more likely events in planning.”
This research was funded in part by the National Science Foundation.
Study explains how rain droplets attract aerosols out of the atmosphere
Jennifer Chu | MIT News Office
As a raindrop falls through the atmosphere, it can attract tens to hundreds of tiny aerosol particles to its surface before hitting the ground. The process by which droplets and aerosols attract is coagulation, a natural phenomenon that can act to clear the air of pollutants like soot, sulfates, and organic particles.
Atmospheric chemists at MIT have now determined just how effective rain is in cleaning the atmosphere. Given the altitude of a cloud, the size of its droplets, and the diameter and concentration of aerosols, the team can predict the likelihood that a raindrop will sweep a particle out of the atmosphere.
The researchers carried out experiments in the group’s MIT Collection Efficiency Chamber — a 3-foot-tall glass chamber that generates single droplets of rain at a controlled rate and size. As droplets fell through the chamber, researchers pumped in aerosol particles, and measured the rate at which droplets and aerosols merged, or coagulated.
From the measurements, they calculated rain’s coagulation efficiency — the ability of a droplet to attract particles as it falls. In general, they found that the smaller the droplet, the more likely it was to attract a particle. Conditions of low relative humidity also seemed to encourage coagulation.
Dan Cziczo, an associate professor of atmospheric chemistry at MIT, says the new results, published this month in the journal Atmospheric Chemistry and Physics, represent the most accurate values of coagulation to date. These values, he says, may be extrapolated to predict rain’s potential to clear a range of particles in various environmental conditions.
“Say you’re a modeler and want to figure out how a cloud in Boston cleans the atmosphere versus one over Chicago that’s much higher in altitude — we want you to be able to do that, with this coagulation efficiency number we produce,” Cziczo says. “This can help address issues such as air quality and human health, as well as the effect of clouds on climate.”
The paper’s co-authors are postdoc Karin Ardon-Dryer and former postdoc Yi-Wen Huang.
Overestimating rain
Cziczo’s group is not the first to simulate the interaction of rain and aerosols in the lab. Over the past decade, others have built intricate chambers to track coagulation. But the MIT researchers found these events were very rare, and extremely difficult to pick out. Scientists had known that a droplet’s electric charge plays a big role in attracting particles, so Cziczo and his colleagues began to alter the charges of droplets and particles to force coagulation to occur.
“This is where we really started getting ourselves in trouble as scientists,” Cziczo says of the field. “To actually get the process to work, people were tuning it into a range that was not atmospherically relevant.”
As a result, researchers were seeing many more coagulation events. However, the results were based on electric charges that were much higher than what had been observed in the atmosphere.
“In some cases, we were seeing people using 10 or 100 times the charge, which maybe you’d only see in the middle of the most severe thunderstorm ever,” Cziczo says.
The experiments, Cziczo says, essentially overestimated rain’s cleansing effects.
Stripping a droplet
To get a more accurate picture of coagulation, Cziczo’s group constructed a new chamber with a single-droplet generator, an instrument that can be calibrated to produce single droplets at a specific size, frequency, and charge. Typically, droplet generators impart too much charge onto a droplet. To produce electrical charges that droplets actually carry in the atmosphere, the team used a small radioactive source to strip away a small amount of charge from each droplet.
The team then pumped the lower part of the chamber with aerosol particles of a known size. As they fell to the floor, droplets evaporated, leaving only salt — and, if coagulation occurred, aerosols. The residual particles were then piped through a single particle mass spectrometer, which determined whether salt — and thereby, the droplet — attracted an aerosol.
The researchers ran multiple experiments, varying the relative humidity of the chamber, as well as the droplet size and frequency. They calculated the coagulation efficiency for each run, and found that smaller droplets were more likely to attract aerosols, particularly under conditions of low relative humidity.
Ultimately, Cziczo says, a better understanding of particle and droplet interactions will give scientists a clearer idea of climate change’s trajectory: One of the major uncertainties in global warming projections is how greenhouse gases will affect cloud formation. As clouds play a major role in maintaining the Earth’s radiative budget — how much heat is trapped or escapes — Cziczo says it’s essential to understand the relationship between a cloud’s water droplets and particles in the atmosphere.
“This type of data is lacking in the literature and should improve model simulations of how cloud and fog droplets can scavenge aerosol particles,” says Margaret Tolbert, a professor of chemistry and biochemistry at the University of Colorado who was not involved in the study. “Improvements in understanding aerosol microphysics ultimately helps with predictions of air quality and climate change, since aerosols are central to both.”
This research was funded, in part, by the National Oceanic and Atmospheric Administration.
Paul O'Gorman: Extreme storm modeler
Jennifer Chu | MIT News Office
Several winters back, while shoveling out his driveway after a particularly heavy snowstorm, Paul O’Gorman couldn’t help but wonder: How is climate change affecting the Boston region’s biggest snow events?
The question wasn’t an idle one for O’Gorman: For the past decade, he’s been investigating how a warming climate may change the intensity and frequency of the world’s most extreme storms and precipitation events.
In 2014, O’Gorman decided to look into how increased warming may affect daily snowfall around the world. In a Nature study that has since been widely quoted, he reported that while most of the Northern Hemisphere will see less total snowfall in a warmer climate, regions where the average winter temperature is near a “sweet spot” will still experience severe blizzards that dump over a foot of snow in a single day.
As it happened, the following winter in Boston produced consecutive blizzards that covered the city in a record-breaking 110 inches of snow, with much of it falling in a single month.
O’Gorman was on sabbatical in Australia at the time, and missed the towering snowbanks, damaging ice dams, and citywide gridlock. But Boston’s extreme winter has spurred a follow-on project for O’Gorman, who recently was awarded tenure as associate professor in MIT’s Department of Earth, Atmospheric and Planetary Sciences (EAPS).
“While I have previously studied daily snowfall, it would definitely be interesting to study these extreme monthly snowfalls,” O’Gorman says. “They obviously can have a big impact in an urban environment, as we saw in Boston.”
“Cross-fertilization of ideas”
O’Gorman grew up in Tullamore, a small town in the midlands of Ireland that, like the rest of the country, receives frequent rainfall throughout the year, but seldom experiences very heavy rainfall or snowfall.
Extreme precipitation was far from O’Gorman’s focus when he enrolled at Trinity College in Dublin. There, he chose to study theoretical physics, and later fluid dynamics, which gave him the opportunity to work with supercomputers to simulate fluid flow — work that earned him a master’s degree in high-performance computing.
At the time, O’Gorman was interested in applying his work in fluid dynamics to problems related to turbulence generated by aircraft. In 1999, he headed to the United States, where he pursued a PhD in aeronautics at Caltech.
“That was a bit of a jump culturally, for sure,” O’Gorman recalls. “One of the nice things is, Caltech is kind of a small place where, like MIT, there’s a lot of cross-fertilization of ideas.”
In fact, O’Gorman’s interest in atmospheric science grew out of just such an opportunity. As part of his studies in aeronautical engineering, he took an elective on turbulence in the atmosphere and ocean, taught by climate scientist Tapio Schneider.
“[The class] totally changed the course of my career and interests,” O’Gorman says.
“I had been studying turbulence on small scales, and now I was learning about turbulence at the planetary scale. What struck me about the fluid flow of the atmosphere was that there are different layers, as well as the rotation of the planet, clouds, precipitation, and radiation all interacting at the same time, and there were a lot of unanswered questions that, to me, were all pretty fascinating.”
After earning a PhD in aeronautics, O’Gorman switched career paths, and worked with Schneider as a postdoc, investigating turbulence in the atmosphere — and in particular, the atmosphere’s response to global warming. When Schneider was invited to a scientific meeting on extreme events, O’Gorman began a research project that ultimately set his course on the study of extreme precipitation.
Climate shift
In 2008, O’Gorman joined the EAPS faculty as an assistant professor, and has since been exploring the relationship between atmospheric warming and the atmospheric circulation and extreme events.
Part of his research continues the work he did as a postdoc with Schneider, in which the two studied climate change’s effect on water vapor: As the climate warms, there is more water vapor in the atmosphere, which in turn acts to further heat the atmosphere. The effect of water vapor and latent heat release has not yet been fully incorporated in existing theories of the atmosphere. O’Gorman says understanding water vapor’s role could help explain how climate change affects rapidly deepening storms at mid-latitude locations, such as the United States and Europe.
While much of his work is based on theoretical modeling, O’Gorman occasionally works with actual weather observations. In 2013, he looked to data collected by weather balloons around the world to see how the atmosphere’s temperature varies with altitude in recent decades. There exists a temperature gradient in the lowest layer of the atmosphere, in which temperatures get colder with altitude. O’Gorman and his student Martin Singh had predicted that as the climate warms, this gradient will essentially shift upward. However, the theory hadn’t been tested with observations.
O’Gorman and Singh analyzed data from weather balloons around the world, each of which took temperature measurements as it rose up through the atmosphere. They found that, based on the measurements, the atmosphere’s temperature profile did indeed seem to be shifting upward over time, consistent with the theory.
“We found if you look at the temperature profile in the current climate, you can predict what it will do in a warmer climate,” O’Gorman says. “This is one of the factors that affects how much radiation is emitted to space, which affects how much the planet warms.”
In the next few years, he hopes to take advantage of the increasing computing power of climate models to track the intensity of rain and snowstorms in response to influences such as greenhouse gases.
“Computers have gotten powerful enough now that we can do simulations of the whole globe, while resolving clouds to some extent,” O’Gorman says. “We can study how convection organizes itself on all sorts of different scales, all the way up to planetary scales. So I think this is a very exciting moment.”