
News + Media

"The warmer climate gets, the faster the climate zones are shifting. This could make it harder for plants and animals to adjust," said lead author Irina Mahlstein.
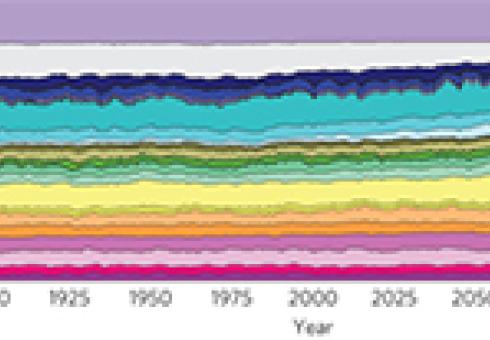
The study is the first to look at the accelerating pace of the shifting of climate zones, which are areas of the Earth defined by annual and seasonal cycles of temperature and precipitation, as well as temperature and precipitation thresholds of plant species. Over 30 different climate zones are found on Earth; examples include the equatorial monsoonal zone, the polar tundra zone, and cold arid desert zone.
"A shift in the climate zone is probably a better measure of 'reality' for living systems, more so than changing temperature by a degree or precipitation by a centimeter," said Mahlstein.
The scientists used climate model simulations and a well-known ecosystem classification scheme to look at the shifts between climate zones over a two-century period, 1900 to 2098. The team found that for the initial 2 ° Celsius (3.6 ° Fahrenheit) of warming, about 5 percent of Earth's land area shifts to a new climate zone. The models show that the pace of change quickens for the next 2 ° Celsius of warming, and an additional 10 percent of the land area shifts to a new climate zone. "Pace of shifts in climate regions increases with global temperature" was published online in the journal Nature Climate Change on April 21.
Certain regions of the globe, such as northern middle and high latitudes, will undergo more changes than other regions, such as the tropics, the scientists found. In the tropics, mountainous regions will experience bigger changes than their surrounding low-altitude areas.
In the coming century, the findings suggest that frost climates–the coldest climate zone of the planet–are largely decreasing. Generally, dry regions in different areas of the globe are increasing, and a large fraction of land area is changing from cool summers to hot summers.
The scientists also investigated whether temperature or precipitation made the greater impact on how much of the land area changed zones. "We found that temperature is the main factor, at least through the end of this century," said Mahlstein.
This story is adapted from a news article at esrl.noaa.gov.

Researcher Eric Martinot presents findings of two-year project at campus event
Professor Eric Martinot, the senior research director with the Institute for Sustainable Energy Policies in Tokyo, told students and faculty at a seminar on April 18 that renewables have become “mainstream” and are “a major part of our energy system.”
Martinot just completed a two-year project entitled the Renewables Global Futures Report — a compilation of 170 face-to-face interviews conducted with industry executives, CEOs of renewable energy companies, utility leaders, government officials and researchers.
“We’re still thinking about the future of renewable energy like it’s 1990 or like it’s the year 2000,” Martinot said. “Our thinking is just behind the reality of where renewables are today and where they are going based on existing market technology, cost and finance trends.”
Martinot gave an overview of various projections and scenarios from the oil industry, the International Energy Agency (IEA) and environmental groups. The data shows that investment in renewables is a key example of the current growth and expected trajectory. Renewable energy investment is predicted to double if not by 2020, then by 2040.
“For the last three years, since 2010, global investment in renewable energy has exceeded investment in fossil fuels and nuclear power generation capacity. That’s very surprising to most people,” he said.
Despite this growth, Martinot said, “existing sources of finance are not going to enable us to reach high levels of renewables. Bank lending and utility balance sheet finance are the two major current finance mechanisms and they are going to run out.” In the future we should expect to see new sources of investment — including pension funds, oil companies and community funds.
Renewables currently supply about 20 percent of global electricity — with hydropower making up about 15 percent of that and all other renewables (wind, solar, geothermal and biomass) making up five percent. Martinot sees potential in expanding renewables to heating and cooling in the near future.
“We have all of the technologies we need right now, we don’t need to wait for technology for high shares of heating and cooling from renewables, but this is going to involve huge changes in building construction, architectural practices, building materials, the whole construction industry,” he explained. “It can take decades for all of that to change. But we can do it.”
Integration of renewables into the grid, buildings, homes and vehicles is where he sees the greatest opportunities for investment, infrastructure and research.
“Power grids have been operated and designed for the last 100 years on the basis of two things: number one, energy storage is impossible and number two, that supply has to meet demand,” he said. Because of the variability of renewables, integration and management of both storage and demand are necessary.
Martinot believes we are on the path toward combating these challenges. “We’re seeing both of those turned on their head because energy storage has become practical and is being done on a commercial basis on a number of projects. We’re also seeing the so-called ‘demand response’ where you can actually adjust demand to meet supply, rather than the other way around.”
Utilities in Denmark and Germany, for example, are using new tools to manage the variability of wind and solar and are able to switch to natural gas and heat when needed.
The building sector is another opportunity to integrate current renewable energy sources with the demands of the typical family home. Martinot described homes of the future that utilize solar power for heating and hot water, electric vehicles with batteries used by the home for power and energy storage, passive heat storage in building construction, and geothermal heat pumps to power homes.
“If you were able to standardize this type of construction in architectural practices around the world this could lower the cost and make if more common in peoples’ homes,” he said.
Martinot admitted he’s bullish about renewables and has high hopes that we can reduce carbon emissions and provide affordable energy.
His research shows that we can be optimistic about the future of renewables as governments, utilities and energy companies are expanding investment, research and development in renewable power across a variety of sectors.
Read Martinot's complete presentation.
Earth Day talk details Massachusetts’ accomplishments since the governor’s MIT speech five years ago
By: David L. Chandler
April 29, 2013
Earth Day talk details Massachusetts’ accomplishments since the governor’s MIT speech five years ago, and outlines new goals.
In an Earth Day address at MIT in 2008, Massachusetts Gov. Deval Patrick outlined an ambitious set of goals that he said could achieve significant reductions in greenhouse-gas emissions and create businesses and jobs based on clean-energy solutions. In a follow-up talk this week, he described a series of successes in achieving these goals.
“Five years ago,” MIT President L. Rafael Reif said in introducing Patrick, the governor “delivered an inspiring challenge: He argued that the commonwealth could improve its environment and its economy by leading the way in energy efficiency and clean-energy innovation.”
In the ensuing years, Reif said, Patrick delivered on that promise: “Today, thanks to his leadership, Massachusetts ranks first in the nation in state-level energy efficiency.”
In addition, Reif said, “Harmful pollution and emissions are both declining, and clean-energy jobs are on the rise. Massachusetts has proven by example that we can have a strong economy and a healthy environment.”
Patrick said that five years ago, “We in Massachusetts took a fresh look at our energy future.” He noted that “with no oil, coal or natural gas of our own, we are at the end of the pipeline and are subject to the whims of a global energy market.”
To address that, Patrick pushed for three pieces of legislation, he said: “First, the Green Communities Act enabled us to set ambitious goals for renewable energy: 250 megawatts of solar by 2017 and 2,000 megawatts of wind by 2020.” (The commonwealth had previously produced only 3 megawatts each of solar and wind energy, he said.)
The second piece of legislation, called the Global Warming Solutions Act, set a series of goals for reductions in greenhouse-gas emissions, calling for a reduction of 25 percent (from 1990 levels) by 2020, and a cut of 80 percent by 2050.
The third piece was the Green Jobs Act, aimed at “capturing the opportunities to foster innovation and create jobs,” Patrick said. Currently, 80 percent of money spent on energy in Massachusetts goes to out-of-state companies. But by creating new clean-energy businesses here, he said, “With the world in the midst of an energy revolution, we were convinced that if we got this right, the world would be our customer.”
In summarizing the outcomes of those actions, Patrick said, “I am here to report that it’s working.” For example, he said, “The American Council for an Energy Efficient Economy has ranked Massachusetts the No. 1 state in energy efficiency for two consecutive years — ahead of longtime leader California.”
The governor added, “We installed more than 100 megawatts of solar power last year alone — ranking us sixth last year in total capacity added.”
Not only has this been good for the environment, but it has been good business, he said: “There are nearly 5,000 clean-energy firms in Massachusetts today, employing some 72,000 people — an impressive 11.2 percent growth in jobs in just the last year.”
There’s more in store: With the nation’s first offshore wind farm about to be built in Nantucket Sound, and a test facility for turbine blades in Charlestown, he said, “The U.S. Department of Energy projects 20,000 jobs by 2020 in offshore wind. Why not host those jobs here in Massachusetts?”
Patrick also outlined a next crucial area of environmental sustainability: “We see water innovation as the next opportunity for Massachusetts to seize,” he said. “The same concentration of brainpower in this and other world-class universities and research facilities that spawned and feeds the life sciences and high-tech revolution in Massachusetts is at the center of this next big push in water innovation.”
Although the focus of the MIT Energy Initiative-sponsored talk was Earth Day and environmental issues, Reif’s introduction also alluded to the governor’s leadership since the Boston Marathon bombing. “I believe I can speak for the entire MIT community in saying thank you for your leadership over the past 10 days,” Reif said. “It has been a terrible and confusing time, and you offered calm, clarity, sympathy and reassurance.”
Patrick noted those events also, including his attendance at Wednesday’s memorial service: “Yesterday’s tribute to Officer Sean Collier was beautiful and fitting,” he said. But, he said, despite the tragic events, “One shining remnant of this experience has been the re-emergence of a strong sense of community, the notion of common stake and common cause.”
He said that in light of that, “I am convinced that there isn’t a single challenge that we face in this state or in this country that can’t be surmounted by a renewed sense that we have a stake in each other’s dreams and struggles.”
Watch the Governor's speech here.

By Charles C. Mann
New technology and a little-known energy source suggest that fossil fuels may not be finite. This would be a miracle—and a nightmare.
As the great research ship Chikyu left Shimizu in January to mine the explosive ice beneath the Philippine Sea, chances are good that not one of the scientists aboard realized they might be closing the door on Winston Churchill’s world. Their lack of knowledge is unsurprising; beyond the ranks of petroleum-industry historians, Churchill’s outsize role in the history of energy is insufficiently appreciated.
Winston Leonard Spencer Churchill was appointed First Lord of the Admiralty in 1911. With characteristic vigor and verve, he set about modernizing the Royal Navy, jewel of the empire. The revamped fleet, he proclaimed, should be fueled with oil, rather than coal—a decision that continues to reverberate in the present. Burning a pound of fuel oil produces about twice as much energy as burning a pound of coal. Because of this greater energy density, oil could push ships faster and farther than coal could.
Churchill’s proposal led to emphatic dispute. The United Kingdom had lots of coal but next to no oil. At the time, the United States produced almost two-thirds of the world’s petroleum; Russia produced another fifth. Both were allies of Great Britain. Nonetheless, Whitehall was uneasy about the prospect of the Navy’s falling under the thumb of foreign entities, even if friendly. The solution, Churchill told Parliament in 1913, was for Britons to become “the owners, or at any rate, the controllers at the source of at least a proportion of the supply of natural oil which we require.” Spurred by the Admiralty, the U.K. soon bought 51 percent of what is now British Petroleum, which had rights to oil “at the source”: Iran (then known as Persia). The concessions’ terms were so unpopular in Iran that they helped spark a revolution. London worked to suppress it. Then, to prevent further disruptions, Britain enmeshed itself ever more deeply in the Middle East, working to install new shahs in Iran and carve Iraq out of the collapsing Ottoman Empire.
Churchill fired the starting gun, but all of the Western powers joined the race to control Middle Eastern oil. Britain clawed past France, Germany, and the Netherlands, only to be overtaken by the United States, which secured oil concessions in Turkey, Iraq, Bahrain, Kuwait, and Saudi Arabia. The struggle created a long-lasting intercontinental snarl of need and resentment. Even as oil-consuming nations intervened in the affairs of oil-producing nations, they seethed at their powerlessness; oil producers exacted huge sums from oil consumers but chafed at having to submit to them. Decades of turmoil—oil shocks in 1973 and 1979, failed programs for “energy independence,” two wars in Iraq—have left unchanged this fundamental, Churchillian dynamic, a toxic mash of anger and dependence that often seems as basic to global relations as the rotation of the sun.
All of this was called into question by the voyage of the Chikyu (“Earth”), a $540 million Japanese deep-sea drilling vessel that looks like a billionaire’s yacht with a 30-story oil derrick screwed into its back. The Chikyu, a floating barrage of superlatives, is the biggest, glitziest, most sophisticated research vessel ever constructed, and surely the only one with a landing pad for a 30-person helicopter. The central derrick houses an enormous floating drill with a six-mile “string” that has let the Chikyu delve deeper beneath the ocean floor than any other ship.
The Chikyu, which first set out in 2005, was initially intended to probe earthquake-generating zones in the planet’s mantle, a subject of obvious interest to seismically unstable Japan. Its present undertaking was, if possible, of even greater importance: trying to develop an energy source that could free not just Japan but much of the world from the dependence on Middle Eastern oil that has bedeviled politicians since Churchill’s day.
In the 1970s, geologists discovered crystalline natural gas—methane hydrate, in the jargon—beneath the seafloor. Stored mostly in broad, shallow layers on continental margins, methane hydrate exists in immense quantities; by some estimates, it is twice as abundant as all other fossil fuels combined. Despite its plenitude, gas hydrate was long subject to petroleum-industry skepticism. These deposits—water molecules laced into frigid cages that trap “guest molecules” of natural gas—are strikingly unlike conventional energy reserves. Ice you can set on fire! Who could take it seriously? But as petroleum prices soared, undersea-drilling technology improved, and geological surveys accumulated, interest rose around the world. The U.S. Department of Energy has been funding a methane-hydrate research program since 1982.
Nowhere has the interest been more serious than Japan. Unlike Britain and the United States, the Japanese failed to become “the owners, or at any rate, the controllers” of any significant amount of oil. (Not that Tokyo didn’t try: it bombed Pearl Harbor mainly to prevent the U.S. from blocking its attempted conquest of the oil-rich Dutch East Indies.) Today, Churchill’s nightmare has come true for Japan: it is a military and industrial power almost wholly dependent on foreign energy. It is the world’s third-biggest net importer of crude oil, the second-biggest importer of coal, and the biggest importer of liquefied natural gas. Not once has a Japanese politician expressed happiness at this state of affairs.
Japan’s methane-hydrate program began in 1995. Its scientists quickly focused on the Nankai Trough, about 200 miles southwest of Tokyo, an undersea earthquake zone where two pieces of the Earth’s crust jostle each other. Step by step, year by year, a state-owned enterprise now called the Japan Oil, Gas, and Metals National Corporation (JOGMEC) dug test wells, made measurements, and obtained samples of the hydrate deposits: 130-foot layers of sand and silt, loosely held together by methane-rich ice. The work was careful, slow, orderly, painstakingly analytical—the kind of process that seems intended to snuff out excited newspaper headlines. But it progressed with the same remorselessness that in the 1960s and ’70s had transformed offshore oil wells from Waterworld-style exoticisms to mainstays of the world economy.
In January, 18 years after the Japanese program began, the Chikyu left the Port of Shimizu, midway up the main island’s eastern coastline, to begin a “production” test—an attempt to harvest usefully large volumes of gas, rather than laboratory samples. Many questions remained to be answered, the project director, Koji Yamamoto, told me before the launch. JOGMEC hadn’t figured out the best way to mine hydrate, or how to ship the resultant natural gas to shore. Costs needed to be brought down. “It will not be ready for 10 years,” Yamamoto said. “But I believe it will be ready.” What would happen then, he allowed, would be “interesting.”
Already the petroleum industry has been convulsed by hydraulic fracturing, or “fracking”—a technique for shooting water mixed with sand and chemicals into rock, splitting it open, and releasing previously inaccessible oil, referred to as “tight oil.” Still more important, fracking releases natural gas, which, when yielded from shale, is known as shale gas. (Petroleum is a grab-bag term for all nonsolid hydrocarbon resources—oil of various types, natural gas, propane, oil precursors, and so on—that companies draw from beneath the Earth’s surface. The stuff that catches fire around stove burners is known by a more precise term, natural gas, referring to methane, a colorless, odorless gas that has the same chemical makeup no matter what the source—ordinary petroleum wells, shale beds, or methane hydrate.) Fracking has been attacked as an environmental menace to underground water supplies, and may eventually be greatly restricted. But it has also unleashed so much petroleum in North America that the International Energy Agency, a Paris-based consortium of energy-consuming nations, predicted in November that by 2035, the United States will become “all but self-sufficient in net terms.” If the Chikyu researchers are successful, methane hydrate could have similar effects in Japan. And not just in Japan: China, India, Korea, Taiwan, and Norway are looking to unlock these crystal cages, as are Canada and the United States.
Not everyone thinks JOGMEC will succeed. But methane hydrate is being developed in much the same methodical way that shale gas was developed before it, except by a bigger, more international group of researchers. Shale gas, too, was subject to skepticism wide and loud. The egg on naysayers’ faces suggests that it would be foolish to ignore the prospects for methane hydrate—and more foolish still not to consider the potential consequences.
If methane hydrate allows much of the world to switch from oil to gas, the conversion would undermine governments that depend on oil revenues, especially petro-autocracies like Russia, Iran, Venezuela, Iraq, Kuwait, and Saudi Arabia. Unless oil states are exceptionally well run, a gush of petroleum revenues can actually weaken their economies by crowding out other business. Worse, most oil nations are so corrupt that social scientists argue over whether there is an inherent bond—a “resource curse”—between big petroleum deposits and political malfeasance. It seems safe to say that few Americans would be upset if a plunge in demand eliminated these countries’ hold over the U.S. economy. But those same people might not relish the global instability—a belt of financial and political turmoil from Venezuela to Turkmenistan—that their collapse could well unleash.
On a broader level still, cheap, plentiful natural gas throws a wrench into efforts to combat climate change. Avoiding the worst effects of climate change, scientists increasingly believe, will require “a complete phase-out of carbon emissions … over 50 years,” in the words of one widely touted scientific estimate that appeared in January. A big, necessary step toward that goal is moving away from coal, still the second-most-important energy source worldwide. Natural gas burns so much cleaner than coal that converting power plants from coal to gas—a switch promoted by the deluge of gas from fracking—has already reduced U.S. greenhouse-gas emissions to their lowest levels since Newt Gingrich’s heyday.
Yet natural gas isn’t that clean; burning it produces carbon dioxide. Researchers view it as a temporary “bridge fuel,” something that can power nations while they make the transition away from oil and coal. But if societies do not take advantage of that bridge to enact anti-carbon policies, says Michael Levi, the director of the Program on Energy Security and Climate Change at the Council on Foreign Relations, natural gas could be “a bridge from the coal-fired past to the coal-fired future.”
“Methane hydrate could be a new energy revolution,” Christopher Knittel, a professor of energy economics at the Massachusetts Institute of Technology, told me. “It could help the world while we reduce greenhouse gases. Or it could undermine the economic rationale for investing in renewable, carbon-free energy around the world”—just as abundant shale gas from fracking has already begun to undermine it in the United States. “The one path is a boon. The other—I’ve used words like catastrophe.” He paused; I thought I detected a sigh. “I wouldn’t bet on us making the right decisions.”
A few years after I graduated from college, I drove with a friend to Southern California, a place I’d never been. I saw a little of Los Angeles, then went north and spent a few days bumbling through the San Joaquin Valley. Going about Bakersfield one night, I got hopelessly lost and ended up at a chain-link fence. Behind the fence were thousands of oil pumps, nodding up and down like so many giant plastic drinking birds. Enshrouding the pumps was a spiderweb of pipes and electrical wires, vast and complex beyond reason, lights and machinery stretching out across the desert farther than I could see. A giant, hypermodern petroleum operation barely 100 miles from Los Angeles! I couldn’t believe it. As I stood gawping, a policeman drove by. I asked him when this complex had sprung up. He looked at me like I was an idiot. “They’ve been drilling here since 1899,” he said.
I was standing by the Kern River oil field, one of the best-known petroleum deposits in the United States. Because I had somehow missed geology in school, I had been left with the vague idea that oil is found in big subterranean pools, like the underground lake where Voldemort conceals part of his soul in the Harry Potter series. In fact, petroleum is usually contained in solid sandstone or limestone strata, which are riddled, spongelike, with minute pores. Or it can occur in thin sheets between layers of shale. Looking at the nodding wells, I had the notion that they were drawing a uniform substance from the ground, a black liquid like the inky water in Voldemort’s lake. Instead, petroleum occurs as a crazy stew of different compounds: oil of various grades mixed with methane, ethane, propane, butane, and other hydrocarbons. Squashed into stone hundreds or thousands of feet underground, this jumble of liquid and gas is usually under great pressure. Layers, or “caps,” of impermeable rock prevent it from seeping to the surface. When drilling bores through the caps, petroleum shoots up in orthodox gusher fashion.
For a long time, companies collected oil and discarded the methane that burbled up with it, often by burning the gas in a cinematic flare atop special derricks, or even simply dumping it into the atmosphere. People did use natural gas for energy—gaslights have existed since the days of Jane Austen—but transporting it was costly. Unlike liquid oil, which could be poured into containers and carried on a railroad network that had already been built and paid for by somebody else, gaseous methane had to be pumped through sealed tubes to its destination, which required energy firms and utilities to lay thousands upon thousands of miles of pipeline. Not until the Second World War and war-production advances in welding did this effort gather speed. (Methane can be cooled into a liquid and transported in pressurized tanks that are loaded and unloaded in special facilities, but this is also expensive.) Oil from wells in Texas is readily dispatched via tanker to Europe or Asia, but even today, natural gas from the same wells is often effectively limited to use in the United States.
From the beginning, it was evident that the Kern River field was rich with oil, millions upon millions of barrels. (A barrel, the unit of oil measurement, is 42 gallons; depending on the grade, a ton of oil is six to eight barrels.) Wildcatters poured into the area, throwing up derricks, boring wells, and pulling out what they could. In 1949, after 50 years of drilling, analysts estimated that just 47 million barrels remained in reserves—a rounding error in the oil business. Kern River, it seemed, was nearly played out. Instead, oil companies removed 945 million barrels in the next 40 years. In 1989, analysts again estimated Kern reserves: 697 million barrels. By 2009, Kern had produced more than 1.3 billion additional barrels, and reserves were estimated to be almost 600 million barrels.
What does it mean when oil companies say they have so many million barrels in reserves? How much energy is in the ground? When will we begin running out? As the history of the Kern River field suggests, these questions are not easy to answer. Indeed, Ph.D.‑toting experts have bombarded Americans for half a century with totally contradictory responses. On one side, pessimists claim that the planet is slowly running out of petroleum. “Turn down the thermostat!” they cry. “Stuff insulation in your walls!” “Buy a hybrid!” “Conserve!” From the other side come equally loud shouts insisting that there are vast, untapped petroleum deposits in Alaska and Alberta and off the coast of Virginia, that geysers of natural gas exist in the shale beds of Pennsylvania and North Dakota, and that huge oil patches await extraction in the deep ocean. “Drill, baby, drill!” “The end of oil!” Al Gore or Sarah Palin, Cassandra or Pollyanna, which side is right? The back-and-forth would be comical if the stakes didn’t involve the fate of human civilization.
When gasoline supplies drop, TV news reporters like to wring their hands at the drivers mobbing the corner Exxon. But the motorists’ panic reflects a basic truth: economic growth and energy use have marched in lockstep for generations. Between 1900 and 2000, global energy consumption rose roughly 17-fold, the University of Manitoba environmental scientist Vaclav Smil has calculated, while economic output rose 16-fold—“as close a link as one may find in the unruly realm of economic affairs.” Petroleum has wreaked all kinds of social and environmental havoc, but a steady supply of oil and gas remains just as central to the world’s economic well-being as it was in Churchill’s day. According to the National Bureau of Economic Research, the United States has experienced 11 recessions since the end of the Second World War. All but one were associated with spikes in energy costs—specifically, abrupt jumps in the price of oil.
Understanding this dependence, the oil industry was shaken by a speech in 1956 by M. King Hubbert, a prominent geophysicist at Shell Oil. When a company moves into a field, it grabs the easy, cheap oil first. Tapping the rest gets progressively more difficult and expensive. Eventually, Hubbert observed, conditions get so tough that production levels off—it peaks. After the peak, decline is unstoppable, the fall as ineluctable as the rise. Hubbert used his theory to predict that the crude-oil yield in the continental United States would flatten between 1965 and 1970 (he didn’t include Alaska and most offshore oil areas). Coming at a time when estimates by the U.S. Geological Survey and the petroleum industry were constantly rising, this claim was derided; indeed, Hubbert claimed that just before giving his speech, a Shell official tried to get him to back off.
Hubbert, not the least self-confident of men, stood his ground, even after he left Shell and in 1964 went to work for the Geological Survey. Unluckily for him, his most prominent critic was now his boss: Vincent E. McKelvey, a long-serving geologist at USGS who would become its director in 1971. As the University of Iowa historian Tyler Priest has documented, McKelvey’s USGS issued a stream of optimistic assessments about the country’s oil future. So did its counterparts in the oil industry. Meanwhile, Hubbert cranked out papers taking the opposite stance, none of them published by the Geological Survey. Inevitably, the dispute grew personal. Three days after McKelvey became the USGS director, he took away Hubbert’s secretary, a harsh measure in the days before e‑mail. According to Priest, Hubbert ended up having to write all his correspondence in longhand; his wife typed his reports at home. Hubbert struck back by helping to kill McKelvey’s nominations to the National Academy of Sciences and the American Academy of Arts and Sciences.
In a blow to McKelvey, Hubbert’s prediction proved to be correct. As domestic crude-oil production peaked and then fell, former Interior Secretary Stewart Udall mocked the sunny claims from the Geological Survey as “an enormous energy balloon of inflated promises and boundless optimism [that] had long since lost touch with any mainland reality.” If Udall were reappointed Interior secretary, he said, “the first thing I would do would be to kick McKelvey out.” In 1977, newly elected President Jimmy Carter, a Hubbertian, forced McKelvey to resign—the first such ouster, Priest notes, “in the Survey’s 98-year history.”
Hubbert’s message of scarcity resonated at a time when the United States was haunted by the specter of Middle Eastern oil blockades. In a nationwide address, President Carter proclaimed that the planet’s proven oil reserves could be consumed “by the end of the next decade.” To forestall the disaster, he fired a volley of energy-efficiency measures: gas-mileage regulation, home-appliance energy standards, conservation tax credits, subsidies for insulation and weatherization. Congress enacted incentives and restrictions to induce industry to switch from supposedly scarce oil and natural gas to coal, which the U.S. has in abundance.
Alas, petroleum firms found so much crude oil in the 1980s that by the 1990s, prices (after adjusting for inflation) had fallen to one-fifth of what they had been during the Carter administration. Estimates of reserves rose and rose again. Energy conservation faltered; oil and gas were too cheap to be worth saving.
The argument has nonetheless continued, pessimists and optimists hammering at each other like Montagues and Capulets. Most of the Hubbertians are physical scientists; most of the McKelveyans, social scientists. Central to the conflict is their differing concepts of a reserve. Recall, as an example, the Kern River field. Its thousands of nodding pumps are siphoning up oil so thick and heavy that it almost doesn’t float on water. Although drillers knew from the first that the field was abundant, they could barely wrest any of this goop from the ground, a factor reflected in the first estimate of the reserve (47 million barrels of recoverable oil). Between that estimate and the second (697 million barrels), engineers developed a precursor to fracking: shooting hot steam down Kern River wells to thin the oil and force it out of the stone. At first, the process was hideously inefficient: heating the water to produce the steam required as much as 40 percent of the oil that came out of the wells. Burning unrefined crude oil released torrents of pollution: nitrous oxide, sulfur dioxide, carbon dioxide. But it squeezed out petroleum that had seemed impossible to reach.
At the same time, the industry learned how to burrow farther into the Earth, opening up previously inaccessible deposits. In 1998, an oil rig near the Kern River field drilled thousands of feet deeper than any previous attempt in the area. At 17,657 feet, the well blew out in a classic gusher. Flames shot 300 feet in the air. The blast destroyed the well and everything else on the site. Even after the fire burned out, petroleum flooded from the hole for another six months. Energy firms guessed that the blowout hinted at the presence of big new oil-and-gas deposits. Earlier assessments had missed them because of their great depth. Investors rushed in and began to drill.
To McKelveyan social scientists, such stories demonstrate that oil reserves should not be thought of as physical entities. Rather, they are economic judgments: how much petroleum experts believe can be harvested from given areas at an affordable price. Even as companies drain off the easy oil, innovation keeps pushing down the cost of getting the rest. From this vantage, the race between declining oil and advancing technology determines the size of a reserve—not the number of hydrocarbon molecules in the ground. Companies that scrambled to follow the Kern River gusher found millions of barrels of deep oil, but it was mixed with so much water that they couldn’t stop the wells from flooding. Within a few years, almost all the new rigs ceased operation. The reserve vanished, but the oil remained.
This perspective has a corollary: natural resources cannot be used up. If one deposit gets too expensive to drill, social scientists (most of them economists) say, people will either find cheaper deposits or shift to a different energy source altogether. Because the costliest stuff is left in the ground, there will always be petroleum to mine later. “When will the world’s supply of oil be exhausted?” asked the MIT economist Morris Adelman, perhaps the most important exponent of this view. “The best one-word answer: never.” Effectively, energy supplies are infinite.
Sweeping claims like these make Jean Laherrère’s teeth hurt. Laherrère spent 37 years exploring for oil and gas for the French petroleum company Total before co-founding the Association for the Study of Peak Oil and Gas. ASPO was born after Laherrère and Colin Campbell, another retired petroleum geologist, predicted in 1998 that “within the next decade, the supply of conventional oil will be unable to keep up with demand.” Given the record-high petroleum reserves of the time, the claim was gutsy. Campbell and Laherrère insisted that talk of ever more oil was nonsense. In the 1980s, the Organization of the Petroleum Exporting Countries, the intergovernmental cartel that controls most crude oil, discussed allocating sales on the basis of member states’ reserves: the bigger a nation’s reserves, the more oil OPEC would let that nation sell. In such a system, countries would have every incentive to overstate their holdings. As Campbell and Laherrère noted, six of the 11 OPEC members abruptly hiked their reserve estimates during these discussions. Incredibly, some nations more than doubled their estimates, without a word of explanation for why they now had so much more oil in the ground. (OPEC eventually decided not to allocate oil in this way.) The supposed glut was a charade, Laherrère told me when we spoke in February. The reserves didn’t exist. “We said the [plateau in oil production]would begin before 2010, and we were correct.”
Far from being infinite, Laherrère said, petroleum supplies are finite by definition. The Earth contains only so many hydrocarbon molecules that can be extracted by human effort. “Once we have used up the easy oil, new types of cheap energy will not appear by magic. We will keep drilling for oil, and it will not be easy to get. Look at the enormously expensive equipment they use now only to keep up production.”
Oil prices soared, as if on cue, after Laherrère and Campbell’s prediction. By 2008, they had hit levels unseen since the Carter administration. “The supply of oil is limited,” President George W. Bush declared that year, echoing his predecessor. “There is a growing consensus that the age of cheap oil is coming to an end,” announced the British government’s Energy Research Centre. “A peak of conventional oil production before 2030 appears likely and there is a significant risk of a peak before 2020.” Bookstore shelves shudder beneath the avalanche of warnings: The Big Flatline: Oil and the No-Growth Economy. Peak Oil and the Second Great Depression (2010–2030). The End of Growth. The Crash Course. Peeking at Peak Oil. (All have come out in the past three years.)
McKelveyans remain undeterred. Morris Adelman is in failing health and could not speak to me, but I reached two of his students, Michael Lynch and Philip K. Verleger. Lynch, the president of the energy-consulting firm SEER, agreed with Laherrère that reserve estimates are sometimes manipulated for financial reasons—Shell’s chairman resigned in 2004, after the company was caught misstating its reserves—but didn’t think it mattered much. “Shell is still pumping oil,” he said. “The peak-oil people always say, ‘Look at this super-technological rig—see how expensive the equipment is now.’ I see it and think, Look at how good we’ve gotten at doing this.” Lynch added, “The airlines have jettisoned their wooden biplanes and now use 747s. That’s not because we’re running out of sky and it’s harder to fly. It’s because the technology is getting better and increasing our reach.”
More important, to Verleger’s way of thinking, the peak-oil battle has become irrelevant. Verleger, a former economic official in the Ford and Carter administrations, is now a visiting fellow at the Peterson Institute for International Economics in Washington, D.C. Since Hubbert’s time, the dispute has focused on “conventional” petroleum, the type found in regular oil wells, most of which is in the Middle East and controlled by OPEC. Production of conventional oil has indeed plateaued, as Hubbertians warned: OPEC’s output has remained roughly flat since 2005. In part, the slowdown reflects the diminishing supply of this kind of oil. Another part is due to the global recession, which has stalled demand. But a third factor is that OPEC’s conventional petroleum is being supplemented—and possibly supplanted—by what the industry calls “unconventional” petroleum, which for the moment mainly means oil and natural gas from fracking. Fracking, Verleger says, is creating “the biggest change in energy in almost 100 years—a revolution.” That revolution, in his view, will have a big winner: the United States.
The argument is simple. The need to import expensive foreign oil has been a political and economic burden on the United States for decades. Today, though, fracking is unleashing torrents of oil in North Dakota and Texas—it may create a second boom in the San Joaquin Valley—and floods of natural gas in Pennsylvania, West Virginia, and Ohio. So bright are the fracking prospects that the U.S. may become, if only briefly, the world’s top petroleum producer. (“Saudi America,” crowed The Wall Street Journal. But the parallel is inexact, because the U.S. is likely to consume most of its bonanza at home, rather than exporting it.) Oil may cost more than in the past, but prices will surely stabilize. No more spikes! Still more important, this nation is fracking so much natural gas that its price today is less than a third of its price in Europe and Asia—a big cost advantage for American industry. As companies switch to cheap natural gas, a Citigroup report argued last year, the U.S. petroleum boom could add as much as 3.3 percent to America’s GDP in the next seven years.
Until about 1970, the United States produced almost enough petroleum for its own needs. Then, just as Hubbert predicted, domestic oil production began to wane. Suddenly the United States was vulnerable. OPEC had launched an oil embargo in 1967, but it had next to no effect, because the U.S. produced so much of its own oil. Six years later, with U.S. imports surging, OPEC launched a second embargo. Oil prices quadrupled—and caused a massive panic, complete with fistfights at gas stations that were broadcast and rebroadcast on local TV news. “Energy independence!” was the new call from Washington. Perhaps the only ideal shared by Nixon, Carter, and Reagan, it became the holy grail of American politics. George W. Bush, flanked by Democrats, signed the Energy Independence and Security Act of 2007; Barack Obama, fighting with Republicans, has repeatedly touted the need to “get America closer to energy independence.”
Largely because of little-noticed research by government agencies and small companies, that goal is within sight, says Leonardo Maugeri, a former director of the petrochemical division of the Italian energy firm Eni. The United States will still import oil, he argued last summer in a report from Harvard’s Kennedy School of Government. But domestic production will increase so much that by 2020, all of this country’s oil needs “theoretically could come entirely from the Western Hemisphere.” Within a decade, in other words, the U.S. could, if it wanted, stop importing oil from the Middle East. In November, the International Energy Agency agreed, though it pushed the date of independence to 2035. The fracking-led oil-and-gas boom, Philip Verleger said in January, will lead to an American “economic Renaissance.” The United States will at last escape the world made by Churchill, at least for a while.
Nations like Japan, China, and India will still be stuck in that world, as will much of Europe and Southeast Asia. Many of these nations do not have shale deposits to frack, the requisite technological base, or, even if they have both the shale and the technology, the entrepreneurial infrastructure to finance such sweeping changes. Nonetheless, they want to be freed from their abrasive reliance on OPEC. The United States and Canada, mindful that the good times will not last forever, are also hunting for new supplies. All have been looking with ever-increasing interest at a still-larger energy source: methane hydrate.
The land sheds organic molecules into the water like a ditchdigger taking a shower. Sewage plants, fertilizer-rich farms, dandruffy swimmers—all make their contribution. Plankton and other minute sea beings flourish where the drift is heaviest, at the continental margins. When these creatures die, as all living things must, their bodies drizzle slowly to the seafloor, creating banks of sediment, marine reliquaries that can be many feet deep. Microorganisms feed upon the remains.
In a process familiar to anyone who has seen bubbles coming to the surface of a pond, the microbes emit methane gas as they eat and grow. This undersea methane bubbles up too, but it quickly encounters the extremely cold water in the pores of the sediment. Under the high pressure of these cold depths, water and methane react to each other: water molecules link into crystalline lattices that trap methane molecules. A cubic foot of these lattices can contain as much as 180 cubic feet of methane gas.
Most methane hydrate, including the deposit Japan is examining in the Nankai Trough, is generated in this way. A few high-quality beds accumulate when regular natural gas, the kind made underground by geologic processes, leaks from the earth into the deep ocean. However methane hydrate is created, though, it looks much like everyday ice or snow. It isn’t: ordinary ice cannot be set on fire. More technically, ice crystals are typically hexagonal, whereas methane-hydrate crystals are clusters of 12- or 14-sided structures that in scientists’ diagrams look vaguely like soccer balls. Methane molecules rattle about inside the balls, unable to escape. The crystals don’t dissolve in the sea like ordinary ice, because water pressure and temperature keep them stable at depths below about 1,000 feet. Scientists on the surface refer to them by many names: methane hydrate, of course, but also methane clathrate, gas hydrate, hydromethane, and methane ice.
Estimates of the global supply of methane hydrate range from the equivalent of 100 times more than America’s current annual energy consumption to 3 million times more. A tiny fraction—1 percent or less—is buried in permafrost around the Arctic Circle, mostly in Alaska, Canada, and Siberia. The rest is beneath the waves, a reservoir so huge that some scientists believe sudden releases of undersea methane eons ago set off abrupt, catastrophic changes in climate. Humankind cannot tap into the bulk of these deep, vast deposits by any known means. But even a small proportion of a very big number is a very big number.
Hydrates were regarded purely as laboratory curiosities until the 1930s, when a Texas petroleum researcher realized that they were clogging natural-gas pipelines in cold weather. Three decades later, exploration in Siberia revealed gelid bands of methane hydrate embedded in the tundra. Meanwhile, oceanographers were observing anomalies in sonar readings of the seafloor. Some areas of the bottom bounced sound waves back more sharply than one would expect from muddy sediment. It was like waving a flashlight in a dark room and being startled by the flash from a mirror. Three geologists suggested in 1971 that these reflective zones were layers of methane hydrate. Not until 1982 did researchers obtain a large chunk of methane hydrate—a three-foot section of a core sample. The gas inside was 99.4 percent methane. That year, the United States established a methane-hydrate research program.
The investigation was a small, belated part of a global push into unconventional petroleum that had been spurred by the oil shocks of the 1970s. For civilians, understanding unconventionals is difficult, not least because of the taxonomic hodgepodge the industry uses to describe them: tar sands, tight oil, heavy oil, shale gas, coal-bed methane, shale oil, oil shale. (Exasperatingly, shale oil is different from oil shale.) All of these different flavors of petroleum are “unconventional” simply because in the past they were too hard to pull from the earth to be worth the bother. Nowadays technology has made many of them accessible.
With the odd exception, unconventionals can be broken into two rough categories: forms of petroleum that are heavier and less refined than the crudest of crude oil, and forms that are lighter and more refined than crude oil. Both are worth huge sums and entangled in dispute, much like conventional petroleum. But the second category, which includes the natural gas from methane hydrate, seems likely to play a much larger role in humankind’s future—economically, politically, and, most of all, environmentally.
The first, heavy category consists of petroleum that must be processed on-site to be transformed into oil. Tar sands, for instance, consist of ordinary sand mixed with bitumen, a sludgy black goo that hasn’t withstood enough geological heat and pressure to be converted fully into ordinary oil. The most important tar-sand deposits are underneath an expanse of subarctic forest in central Canada that is roughly the size of England; they make up the third-biggest proven oil reserve in the world. In most cases, mining tar sands involves drilling two horizontal wells, one above the other, into the bitumen layer; injecting massive gouts of high-pressure steam and solvents into the top well, liquefying the bitumen; sucking up the melted bitumen as it drips into the sand around the lower well; and then refining the bitumen into “synthetic crude oil.” Refining in this case includes removing sulfur, which is then stored in million-ton, utterly useless Ozymandian slabs around mines and refineries.
Economists sometimes describe a fuel in terms of its energy return on energy invested (EROEI), a measure of how much energy must be used up to acquire, process, and deliver the fuel in a useful form. OPEC oil, for example, is typically estimated to have an EROEI of 12 to 18, which means that 12 to 18 barrels of oil are produced at the wellhead for every barrel of oil consumed during their production. In this calculation, tar sands look awful: they have an EROEI of 4 to 7. (Steaming out the bitumen also requires a lot of water. Environmentalists ask, with some justification, where it all is going to come from.)
Conveying tar-sands oil to its biggest potential markets, in the United States, will involve building a huge pipeline from Alberta to Texas, which has attracted vituperative opposition from environmental groups and some local governments. The U.S. State Department has long delayed issuing permits to allow this pipeline to cross the border, a stall that has outraged energy boosters, who charge that the Obama administration is spitting in the soup of Canada, America’s most important ally. The boosters say little about the two 100 percent Canadian pipelines—one to shoot tar-sands oil to a port in British Columbia, a second to Montreal—that 100 percent Canadian opposition has stalled. All the while, indigenous groups in central Canada, people armed with special powers granted by the Canadian constitution, have carpet-bombed tar-sands country with lawsuits. Regardless of the merits of the protesters’ arguments, it is hard to believe that they will be completely ineffective, or that tar-sands oil will flow freely anytime soon.
Much more prominent is the second unconventional category, the most important subcategory of which is the natural gas harvested by fracking shale. Every few years, the U.S. government produces a map of American shale beds. Flipping through a time series of these maps is like watching the progress of an epidemic—methane deposits pop up everywhere, and keep spreading. To obtain shale gas, companies first dig wells that reach down thousands of feet. Then, with the absurd agility of anime characters, the drills wriggle sideways to bore thousands of feet more through methane-bearing shale. Once in place, the well injects high-pressure water into the stone, creating hairline cracks. The water is mixed with chemicals and “proppant,” particles of sand or ceramic that help keep the cracks open once they have formed. Gas trapped between layers of shale seeps past the proppant and rises through the well to be collected.
Water-assisted fracturing has been in use since the late 1940s, but it became “fracking” only recently, when it was married with horizontal drilling and the advanced sensing techniques that let it be used deep underground. Energy costs are surprisingly small; a Swiss-American research team calculated in 2011 that the average EROEI for fracked gas in a representative Pennsylvania county was about 87—about six times better than for Persian Gulf oil and 16 times better than for tar sands. (Fracking uses a lot of water, though, and activists charge that the chemicals contaminate underground water supplies.) Because of fracking, U.S. natural-gas reserves have jumped by almost three-quarters since 2000.
Shale gas has its detractors. Far from being a game changer, Jean Laherrère told me, shale gas is a “Ponzi scheme” in which oil companies acquire largely fictional methane deposits to polish their balance sheets for Wall Street. A February study from the Post Carbon Institute, an anti-fossil-fuel think tank, dismissed shale gas as, at best, “a temporary reprieve from having to deal with the real problems”; the group’s general tenor is indicated by the special URL it set up for the report: shalebubble.org. But these views are not widely shared. Two days after I last spoke with Laherrère, the head of the U.S. Energy Information Administration told a congressional hearing that the additions to America’s energy reserves ballyhooed in the agency’s most recent report “were—by a large margin—the highest ever recorded since EIA began publishing proved reserve estimates in 1977.”
As Economics 101 would predict, the arrival of vast quantities of methane from fracking has already made U.S. natural-gas prices plummet. In response, hundreds of wells have shut down, preserving methane deposits that can be tapped someday in the future. But U.S. natural-gas production has hardly been affected. Neither has demand: more and more industries, attracted by low prices, are switching to gas from oil and coal—especially coal.
Today, a fifth of U.S. energy consumption is fueled by coal, mainly from Appalachia and the West, a long-term energy source that has provided jobs for millions, a century-old way of life—and pollution that kills more than 10,000 Americans a year (that estimate is from a 2010 National Research Council study). Roughly speaking, burning coal produces twice as much carbon dioxide as burning the equivalent amount of natural gas. Almost all domestic coal is used to generate electricity—it produces 38 percent of the U.S. power supply. Fracking is swiftly changing this: in 2011, utilities reported plans to shut down 57 of the nation’s 1,287 coal-fired generators the following year. Largely in consequence, U.S. energy-related carbon-dioxide emissions have dropped to figures last seen in 1995. Since 2006, they have fallen more than those from any other nation in the world.
The U.S. coal industry has taken to complaining of a “war on coal.” But the economic hit has been less than one would expect; U.S. coal exports, mainly to Europe, almost doubled from 2009 to 2011. In the sort of development that irresistibly attracts descriptors like ironic, Germany, often touted as an environmental model for its commitment to solar and wind power, has expanded its use of coal, and as a result is steadily increasing its carbon-dioxide output. Unlike Americans, Europeans can’t readily switch to natural gas; Continental nations, which import most of their natural gas, agreed to long-term contracts that tie its price to the price of oil, now quite high. “It’s like someone said, ‘We’ll sell you all the tea you want, based on the price of coffee,’ ” Michael Lynch, the energy consultant, told me. “And you said, ‘What a great idea! I’ll lock myself into it for decades.’ ” He laughed. “Truly, you can’t make this stuff up.”
Here I should confess to personal bias. Twelve years ago, a magazine asked me to write an article about energy supplies. While researching, I met petroleum geologists and engineers who told me about a still-experimental technique called hydraulic fracturing. Intrigued, I asked several prominent energy pundits about it. All scoffed at the notion that it would pay off. To be fair, some early fracking research was outlandish; three early trials involved setting off atomic weapons underground (they did produce natural gas, but it was radioactive). I don’t want to embarrass anyone I spoke with. I failed to exercise independent judgment, and did not mention hydraulic fracturing in my article, so I was just as mistaken. But I also don’t want to miss the boat again. Even though plenty of experts discount methane hydrate, I now am more inclined to pay attention to the geologists and engineers who foresee a second, fracking-type revolution with it, a revolution that—unlike the shale-gas rush, mostly a North American phenomenon—will ripple across the globe.
Japan, which has spent about $700 million on methane-hydrate R&D over the past decade, has the world’s biggest hydrate-research program—or perhaps that should be programs, because provincial governments on Japan’s west coast formed a second hydrate-research consortium last year. (Several researchers told me that the current towel-snapping between Beijing and Tokyo over islands in the East China Sea is due less to nationalistic posturing than to nearby petroleum deposits.) In mid-March, Japan’s Chikyu test ended a week early, after sand got in the well mechanism. But by then the researchers had already retrieved about 4 million cubic feet of natural gas from methane hydrate, at double the expected rate. Japan’s Ministry of Economy, Trade, and Industry is eager to create a domestic oil industry; at present, the nation produces just one one-thousandth of its own needs. Perhaps overoptimistically, the ministry set 2018 as a target date for commercializing methane hydrate. India and South Korea are following along, each spending as much as $30 million a year on hydrate experiments; the Korean program is growing especially aggressively.
By contrast, the U.S. Department of Energy program is small—its annual budget is about $15 million, most of which is devoted to basic research on gas hydrates’ formation and location. About $2.4 million goes to U.S. Geological Survey methane-hydrate researchers, who have been test-mining onshore deposits in frigid Alaska and northwestern Canada. Based in Woods Hole, Massachusetts, and Denver, Colorado, the USGS program has about eight full-time researchers, as well as collaborators from Japan, Canada, Germany, India, and several oil companies.
Although most U.S. research has been in the far north, the most promising U.S. deposits are in the Gulf of Mexico. Hydrates are thought to blanket about 174,000 square miles of the gulf, an area about the size of California. At least part of the deposit, seepage from conventional hydrocarbon reservoirs, is top-quality stuff, though nobody has any idea how much is actually recoverable. What is known, says Timothy Collett, the energy-research director for the USGS program, is that some of the gulf’s more than 3,500 oil and gas wells are in gas-hydrate areas. Extracting these hydrates, in his view, is the logical next step. “To keep feeding the infrastructure, you have to maintain a certain return. Otherwise, you’ll abandon it,” he told me. “For the individual manager of a large installation with a multimillion-dollar budget, it might be well within your interest, as you go into decline on deepwater production, to start looking at gas hydrate.”
If one nation succeeds in producing commercial quantities of undersea methane, others will follow. U.S.-style energy independence, or something like it, may become a reality in much of Asia and West Africa, parts of Europe, most of the Americas. To achieve this dream, history suggests, subsidies to domestic producers will be generous and governments will slap fees on petroleum imports—especially in Asia, where dependence on foreign energy is even more irksome than it is here. In addition to North America, the main sources of conventionally extracted natural gas are Russia, Iran, and Qatar (Saudi Arabia is also an important producer). All will feel the pinch in a methane-hydrate world. If natural gas from methane hydrate becomes plentiful and cheap enough to encourage nations to switch from oil, as the Japanese hope, the risk pool will expand to include Brunei, Iraq, Nigeria, the United Arab Emirates, Venezuela, and other petro-states.
The results in those nations would be turbulent. Petroleum revenues, if they are large, exercise curious and malign effects on their recipients. In 1959, the Netherlands found petroleum on the shores of the North Sea. Money gurgled into the country. To general surprise, the flood of cash led to an economic freeze. Afterward, economists realized that salaries in the new petroleum industry were so high that nobody wanted to work anywhere else. To keep employees, companies in other parts of the economy had to jack up wages, in turn driving up costs. Meanwhile, the surge of foreign money into the Netherlands raised the exchange rate. Soaring costs and currency made it harder for Dutch firms to compete; manufacturing and agriculture faltered; unemployment climbed, except in the oil industry. The windfall led to stagnation—a phenomenon that petroleum cognoscenti now call “Dutch disease.”
Some scholars today doubt how much the Netherlands was actually affected by Dutch disease. Still, the general point is widely accepted. A good modern economy is like a roof with many robust supporting pillars, each a different economic sector. In Dutch-disease scenarios, oil weakens all the pillars but one—the petroleum industry, which bloats steroidally.
Worse, that remaining pillar becomes so big and important that in almost every nation, the government takes it over. (“Almost,” because there is an exception: the United States, the only one of the 62 petroleum-producing nations that allows private entities to control large amounts of oil and gas reserves.) Because the national petroleum company, with its gush of oil revenues, is the center of national economic power, “the ruler typically puts a loyalist in charge,” says Michael Ross, a UCLA political scientist and the author of The Oil Curse (2012). “The possibilities for corruption are endless.” Governments dip into the oil kitty to reward friends and buy off enemies. Sometimes the money goes to simple bribes; in the early 1990s, hundreds of millions of euros from France’s state oil company, Elf Aquitaine, lined the pockets of businessmen and politicians at home and abroad. Often, oil money is funneled into pharaonic development projects: highways and hotels, designer malls and desalination plants. Frequently, it is simply unaccounted for. How much of Venezuela’s oil wealth Hugo Chávez hijacked for his own political purposes is unknown, because his government stopped publishing the relevant income and expenditure figures. Similarly, Ross points out, Saddam Hussein allocated more than half the government’s funds to the Iraq National Oil Company; nobody has any idea what happened to the stash, though, because INOC never released a budget. (Saddam personally directed the nationalization of Iraqi oil in 1972, then leveraged his control of petroleum revenues to seize power from his rivals.)
Shortfalls in oil revenues thus kick away the sole, unsteady support of the state—a cataclysmic event, especially if it happens suddenly. “Think of Saudi Arabia,” says Daron Acemoglu, the MIT economist and a co-author of Why Nations Fail. “How will the royal family contain both the mullahs and the unemployed youth without a slush fund?” And there is nowhere else to turn, because oil has withered all other industry, Dutch-disease-style. Similar questions could be asked of other petro-states in Africa, the Arab world, and central Asia. A methane-hydrate boom could lead to a southwest-to-northeast arc of instability stretching from Venezuela to Nigeria to Saudi Arabia to Kazakhstan to Siberia. It seems fair to say that if autocrats in these places were toppled, most Americans would not mourn. But it seems equally fair to say that they would not necessarily be enthusiastic about their replacements.
Augmenting the instability would be methane hydrate itself, much of which is inconveniently located in areas of disputed sovereignty. “Whenever you find something under the water, you get into struggles over who it belongs to,” says Terry Karl, a Stanford political scientist and the author of the classic The Paradox of Plenty: Oil Booms and Petro-States. Think of the Falkland Islands in the South Atlantic, she says, over which Britain and Argentina went to war 30 years ago and over which they are threatening to fight again. “One of the real reasons that they are such an issue is the belief that either oil or natural gas is offshore.” Methane-hydrate deposits run like crystalline bands through maritime flash points: the Arctic, and waters off West Africa and Southeast Asia.
In a working paper, Michael Ross and a colleague, Erik Voeten of Georgetown University, argue that the regular global flow of petroleum, the biggest commodity in world trade, is also a powerful stabilizing force. Nations dislike depending on international oil, but they play nice and obey the rules because they don’t want to be cut off. By contrast, countries with plenty of energy reserves feel free to throw their weight around. They are “less likely than other states to sign major treaties or join intergovernmental organizations; and they often defy global norms—on human rights, the expropriation of foreign companies, and the financing of foreign terrorism or rebellions.” The implication is sobering: an energy-independent planet would be a world of fractious, autonomous actors, none beholden to the others, with even less cooperation than exists today.
None of this is what makes Christopher Knittel use words like catastrophe. What Knittel is thinking of is, so to speak, the little black specks of Yulin, China. Five years ago, I traveled with a friend to Yulin, in the northwestern province of Shaanxi, not far from Mongolia. We visited the Great Wall, which passes just north of town. In that area, the wall itself had mostly crumbled to nothing, except for the watchtowers, which stuck up every half mile or so. People in one tower were supposed to be able to signal to the next, passing on messages like ships at sea.
When I climbed up one eroded tower, I was surprised to find that I couldn’t see its neighbor. There were little black specks all over my glasses. I cleaned the lenses, but was still unable to make out the next tower. The black specks were not just on my glasses.
Walking around town, my friend and I had noticed that almost every home had a pile of coal outside, soft dark chunks that people shoveled into stoves for cooking and heating. Thousands upon thousands of coal fires were loading the air with tiny dots of soot. Scientists have taken to calling these dots “black carbon,” and have steadily ratcheted up their assessments of its harm. In March, for instance, a research team led by a Mumbai environmental group estimated that black carbon and other particulate matter from India’s coal-fired power plants cause about 100,000 deaths a year.
Environmentalists worry even more about black carbon’s role in climate change. Black carbon in the air absorbs heat and darkens clouds. In some places, it alters rain patterns. Falling on snow, it accelerates melting. A 31-scientist team from nine nations released a comprehensive, four-year assessment in January arguing that planetary black-carbon output is the second-biggest driver of anthropogenic (human-caused) climate change; the little black specks I found on my glasses and clothes have roughly two-thirds the impact of carbon dioxide.
Natural gas produces next to no soot and half the carbon dioxide coal does. In coal-heavy places like China, India, the former Soviet Union, and eastern Europe, heating homes and offices with natural gas instead of coal would be a huge step. An MIT study chaired by Ernest Moniz, whom President Obama nominated for energy secretary in March, called natural gas “a cost-effective bridge” to a “low-carbon future.”
The Chinese government is aware of this, which is one reason it is pursuing both shale gas and methane hydrate. But environmentalists are less enthusiastic than one might imagine about the prospect of weaning ourselves from coal with gas. The reason is that methane itself—unburned natural gas—has a much greater capacity to trap solar heat than carbon dioxide does. (Because methane does not remain in the air as long as carbon dioxide, the precise comparison depends on the chosen time frame; researchers typically say that methane is about 20 or 30 times more potent.) Activists fear that the negative effects of obtaining natural gas could swamp the positive effects of burning it. They are entirely correct, although perhaps not in the way they suppose.
Almost every friend and neighbor I have spoken with about methane hydrate asked whether tapping these undersea deposits could release vast amounts of methane all at once, disastrously altering the planet’s environment. According to Carolyn Ruppel of the Geological Survey, these fears are understandable—but misplaced. If things go awry in a hydrate operation, some of the methane will escape into exactly the cold temperatures and high pressures that trapped it to begin with. Some will be consumed by bacteria, producing carbon dioxide, which dissolves in water; this raises the ocean’s acidity, but not enough to have much effect. Any remaining methane will rise out of the sediment and, like the carbon dioxide, dissolve harmlessly in the ocean. (None of this should be confused with a different source of methane: the decayed vegetation in permafrost, which will release methane if the permafrost thaws.)
The real concern, Ruppel and other researchers told me, is less an explosive methane release from under the Earth’s surface—the environmental disaster that might have caused havoc eons ago—than a slow discharge at ground level, from the machinery that will pull methane hydrate out of the seafloor. The problem already exists with fracking. “The rule of thumb is that if a well leaks more than about 3 percent” of its methane production into the air, “natural gas actually becomes dirtier than coal, from a climate-change perspective,” says Ramez Naam, the author of The Infinite Resource, a just-published book about the race between environmental degradation and technological innovation. “The amazing thing, though, is that we don’t have any data—nobody is required to monitor methane at the well. So there’s just a few studies, which vary tremendously.” Worse still, the aging natural-gas infrastructure is riddled with holes and seeps; early this year, a survey of gas mains along Boston’s 785 miles of road, the first-ever such examination, found 3,356 leaks. Last August, the Environmental Protection Agency amended the Clean Air Act to require well operators to recapture some methane; because nobody knows how much natural gas is gushing into the air, the new rules’ impact is uncertain.
Still, fixing leaks is a task that developed nations can accomplish. “In the United States,” Lynch says, “it is possible to hire inspectors and send them out in white vans to measure methane emissions. They can tell companies to spray more silicone in the wellheads. Maybe the companies will kick and scream about the bureaucracy and cost, but this is something that can be done.”
What we can’t do, or at least not readily, is overcome the laws of economics. More...
By: Janet Pelley March 28, 2013
By 2100, the world population will pass 10 billion people. How can we sustain that population, while throttling back climate change? Some scientists think part of the answer is to plant forests and grow biofuel crops, allowing us to use land to sequester carbon. But those changes in land use also could crowd out food crops, raising the cost of food. In ES&T’s Best Policy Analysis Paper of 2012, researchers model the feedback between the atmosphere, Earth’s ecosystems, and the global economy to show that a fossil fuel tax plus incentives for reforestation and biofuels nearly stabilizes the climate by 2100. Unfortunately, the team reports that the trade-off is a hefty rise in food prices (Environ. Sci. Technol., DOI: 10.1021/es2034729).
John Reilly, an energy economist at Massachusetts Institute of Technology, and his team realized that any analysis of climate policies, such as a carbon tax or incentives for reforestation, is complicated by the fact that land use policy, climate, and the economy are tightly linked. For example, as the climate warms, plant productivity changes, which in turn affects people’s decisions about land use, he says. “Thinking of that complex set of interactions and trying to understand what was going on was the motivation for the study,” Reilly says
Previous studies have narrowly focused on one land use at a time, such as finding the best policies to sequester more carbon in forests but ignoring spillover impacts on cropland. Also these studies did not take into account the interactive and downstream effects of a worldwide carbon tax.“Reducing greenhouse gases with a carbon tax will increase energy costs, and energy is a big input in agricultural production,” Reilly says.
His team decided to study a combination of policies—a carbon tax and incentives for reforestation and biofuels—and ask what the effects would be on the climate, food prices, and land use.
To do so, they developed a set of three models that feed data among one another. First, a global economic model, provided by the MIT team, predicts food prices, land use, and greenhouse gas emissions every five years. Next, those emissions estimates drive a climate model that simulates future climate conditions. These climate outputs, such as carbon dioxide and ozone concentrations, then feed into an ecosystem model, developed by Jerry M. Melillo and his team at the Woods Hole Oceanographic Institution. The ecosystem model generates changes in crop and forest productivity. The economic model then uses these productivity changes, along with expected demand for products produced from the land, to reassess land and energy use, which then determines the next set of greenhouse gas emissions estimates. And the cycle continues.
The team members ran their models through the year 2100 under several different policy scenarios. They found that if humanity sticks with the status quo and attempts no change in climate policy, CO2 concentrations reach 900 ppm by 2100, and global mean temperature hits 5.8 °C above preindustrial levels. However, a worldwide tax on fossil fuel emissions limits the CO2 concentration to 520 ppm and holds temperature rise to 2.7 °C. These metrics are still above the targets set by the 2009 Copenhagen Accord, which are a 2 °C temperature increase and CO2 levels around 450 ppm CO2.
When the team added incentives for reforestation and biofuels to a tax on energy, CO2 concentrations reach only 490 ppm and global temperature increases 2.2 °C over preindustrial levels by the end of the century. But Reilly says these better climate statistics come at a price: Competition for agricultural land from reforestation and biofuels boosts food prices by 80%.
Stephen Polasky, an environmental economist at the University of Minnesota, Twin Cities, says that this paper reveals that policy makers cannot think of energy and food policies as independent.
Even though the scenarios in the paper are far more aggressive than any proposed policies suggested right now, fossil fuel use in the models never drops to levels scientists say we need to stabilize the climate, says Steve Running, a terrestrial carbon scientist at the University of Montana. He also says the paper highlights how any solution to the climate problem requires choices and trade-offs when it comes to land use.
Reilly hopes that others will adopt his team’s modeling practices to find sensible polices to improve the climate.
The authors declare no competing financial interest.

Most efforts to address carbon emissions focus on preventing them from entering the atmosphere in the first place. But how to get rid of CO2 already there? Start-ups are developing prototype air-capture systems.
In this Faculty Forum Online broadcast, Knittel discussed his studies of consumer and company reactions to energy price fluctuations and the implications of this work for effective environmental policies.

Introduction
Of all the uncertainties climate change presents, its impact on the production and distribution of food is one of the greatest. We are already feeling the effects: 2012 was a bad year for farmers, with droughts and erratic weather decimating crops and pushing up global food prices. Food prices are at historic highs and there have been two global food crises in the last five years leading to riots in Haiti in 2008 and contributing to the Arab Spring in 2011.
Molly D. Anderson and John Reilly examine the complex challenges and trade-offs humanity faces in a world where climate change is upending traditional assumptions about where and how we can produce enough food for the world’s rapidly growing population.
Molly D. Anderson is a professor at College of the Atlantic and holds the Patrtridge Chair in Food and Sustainable Agriculture Systems.
Until just a few years ago, there were some blithe assumptions about how climate change would affect food security: Like migrating birds, agriculture will simply move north to escape extreme heat, and only food production will be affected by climate change.
Today we recognize that it’s not just temperature, but a whole set of complex interrelated factors — temperature, rainfall, timing, soils, practices throughout the food system and more — that are affected by climate change.
Each crop has its own ideal set of circumstances. Having too many warm nights can be deadly for some crops. Not having enough hours of nighttime freeze can hurt others. Human societies have evolved with agriculture over the last 10,000 years to use particular crops in particular places. Now we’re experimenting with drastic changes in a matter of decades.
It’s not going to be easy, for a number of reasons, for agriculture to just move north. Farming is one of the most place-based occupations in the world. Farmers won’t easily pick up and move north. If they do, the soil they’ll find will be completely different.
Climate change isn’t just affecting the production of food; it’s also affecting consumption of and access to food. Ocean acidification will lower fish catches, which in turn will increase demands on land-based foods. Climate refugees will need new access to food, yet will be unable to produce their own. Food safety will become more challenging.
Food security, as defined by the Food and Agriculture Organization of the UN (FAO), is “when all people, at all times, have physical, social and economic access to sufficient, safe and nutritious food that meets their dietary needs and food preferences for an active and healthy life.”
Even without climate change, with the growing world population, food security will present a challenge. We need to look for win/win solutions — ones that improve food security and sustainability of food systems on the one hand and that mitigate and adapt to climate change on the other.
On the farm level, this means promoting the use of renewable energy in food production, restoring degraded soils and diversifying crops.
On a state and regional level, it means first recognizing food as a basic human right and then making policy decisions that flow from that recognition. For example, using land to produce food would take priority over using land to produce biofuels or animal feed; and states and regions would establish adequate food reserves and be able to set their own food and trade policies. States and regions must promote energy and water efficiency throughout the food system as well.
Globally, we need to slow population growth. One of the most effective ways to do that is to educate girls and women and provide access to contraceptives. We also need to reduce food waste and over-consumption, particularly by wealthy people and nations of the world.
When it comes to food security, the developed world is answering the wrong questions. We’ve focused on increasing availability of food and “feeding the world” (to the benefit of our own corporations). We need to focus on improving food access, reducing our own over-consumption, and addressing why poor people can’t feed themselves in a world with more than enough food for all its inhabitants.
John Reilly is senior lecturer and co-director of the Joint Program on the Science and Policy of Global Change and a senior lecturer at the MIT Sloan School of Management.
Since 1980, the world’s breadbaskets — areas where major crops like maize, wheat, rice, and soy beans are grown — have warmed significantly. Interestingly, the U.S. is the major exception to this global trend. Our agricultural regions have actually experienced somewhat cooler temperatures overall — with a few exceptions.
The effects of climate change on agriculture are likely to be mixed, benefiting crops in some areas and harming crops in others. In colder regions, like New England and much of Canada, growing seasons are becoming longer. We can expect lower crop yields in regions where heat exceeds critical thresholds.
Just as agriculture is a major cause of greenhouse gas emissions, it could also play a major role in mitigating climate change.
Scientists estimate that doubling CO2 concentrations from pre-industrial levels would increase crop yields by as much as 20 to 30 percent, but would also increase the growth of weeds. Furthermore, the increase in crop yields from the effects of more carbon dioxide in the air would largely be offset by the effects of increased temperatures and decreased soil moisture.
Agriculture and climate are both highly complex pieces of the Earth’s ecosystem. Constructing reasonably accurate, useful models of how the two interact is an enormous scientific challenge.
My colleagues at MIT and I have begun developing a model for predicting crop yield changes in the world’s breadbasket regions. We’ve found wide variations in how yields are likely to be affected by climate change. Generally speaking, whether we looked at maize (corn) in North America and West Africa, wheat in Europe and Asia, or soybeans in South America, the results were the same: Areas closer to the equator saw declining yields, some up to 50 percent, while areas closer to the North and South Poles showed increased yields. They balance out at some level, but this kind of change would cause lots of dislocation.
With global population projected to peak at 10 billion sometime after 2050, and with rising incomes allowing more people to eat a resource-intensive diet (i.e. eating more meat), we face great agricultural challenges even without the dislocation and disruption climate change will cause.
Just as agriculture is a major cause of greenhouse gas emissions, it could also play a major role in mitigating climate change. Our studies show that an aggressive global reforestation policy could result in a half-degree Celsius of avoided warming by 2100. The key would be putting a price on carbon for removing carbon dioxide from the atmosphere. This price would create an incentive for landholders to reforest their land, because forests are great absorbers of carbon.
Reforestation comes at a cost. More land for forests means less land for agriculture. That means we could expect to see higher food prices, especially for livestock.
This is part of the trilemma of what to do with land in the 21st century. Do we use it to produce biofuels as a substitute for fossil fuels? Do we use it to produce food? Do we use it to preserve biodiversity and store carbon?
There are unavoidable trade-offs no matter what we decide. There are no easy solutions when it comes to climate change and food security. What is clear is that the worst “solution” would be continued inaction in the face of the overwhelming evidence that climate change has real and growing effects.
John Reilly speaks at Northeastern's Open Classroom on Agriculture, Changing Climate, and Sustainable Food Production.
America Abroad host Madeleine Brand and Henry Jacoby discuss the impact that shale gas -- extracted by the method known as "fracking"-- has had on American energy policy.

First workshop convened high-ranking Chinese environmental officials and experts from top government, university and research offices.
The MIT-Tsinghua China Energy and Climate Project held a workshop on Tuesday March 12 to kick off a landmark study on the impact of China’s vehicle emissions and fuel standards on energy, economic, emissions, air quality and health. The study is being supported by a grant from the Energy Foundation, which provides resources to institutions that most effectively leverage change in transitioning to a sustainable energy future. The workshop, held at Tsinghua University, was hosted by collaborators at the university’s Institute for Energy, Environment, and Economy.
“Understanding the role fuel quality standards could play in cutting China’s emissions and air pollution is crucial to the health of the communities, as well as to addressing growing urban sustainability challenges,” says Valerie Karplus, director of the MIT-Tsinghua China Project and a co-researcher for the study. “This study will provide that insight. We’re grateful to have the support of the Energy Foundation, as well as feedback from a varied stakeholder base.”
The researchers will perform a comparison of policy options for reducing transportation emissions in China. This process will begin with an analysis of China’s transport sector and an updated inventory of emissions by sector. Researchers will also identify regional air quality impacts using a regional chemical transport model and analyze the impact of various policy options on energy use, emissions, the economy and human health.
“This study will be the first to use of an integrated model – simulating travel demand, fuel use, vehicles emissions and air quality – to determine health and economic impacts of fuel policies in China,” Eri Saikawa, a professor at Emory University and the lead researcher for the study, said. “The model will be a powerful tool for assessing transport policy options currently under discussion in China.”
Throughout the project, researchers will communicate their results to policymakers through an ongoing and interactive process. The March 12th workshop was the first of several of these meetings. It brought together stakeholders from China’s Ministry of Environmental Protection and the Beijing Environmental Protection Bureau, as well as experts from Tsinghua University, Beijing University, Nanjing University, Clean Air Initiative-Asia, the International Council on Clean Transportation, the Energy Foundation, and the Health Effects Institute.
At the March 12th meeting, the stakeholders provided input on which policy questions would be of greatest interest for the study to consider and explored how the results of the study might be used within their organizations. It was decided that the research would focus on assessing the impacts of fuel quality standards and tailpipe emissions standards in China, with a focus on the potential benefits of implementing the China 6 standard, which is the toughest standard announced so far and targets deeper reductions in nitrous oxide emissions country-wide before 2020.

On Tuesday, four Democrats in Congress unveiled a brand-new proposal for a carbon tax. The set-up is simple: The U.S. government would slap a fee on fossil-fuel emissions and refund the revenue back to the public.
But there’s a twist: The precise details of the carbon tax have yet to be thrashed out. The four lawmakers are soliciting public comments for how big the tax should be and how best to rebate the money.
The proposal is being put forward by Reps. Henry Waxman and Earl Blumenauer, as well as Sens. Sheldon Whitehouse and Brian Schatz.
Here are the key questions they’re wrestling with:
1. What is the appropriate price per ton for polluters to pay? The draft contains alternative prices of $15, $25 and $35 per ton for discussion purposes.
2. How much should the price per ton increase on an annual basis? The draft contains a range of increases from 2 percent to 8 percent per year for discussion purposes.
3. What are the best ways to return the revenue to the American people? The discussion draft proposes putting the revenue toward the following goals, and solicits comments on how to best accomplish each: (1) mitigating energy costs for consumers, especially low-income consumers; (2) reducing the Federal deficit; (3) protecting jobs of workers at trade-vulnerable, energy intensive industries; (4) reducing the tax liability for individuals and businesses; and (5) investing in other activities to reduce carbon pollution and its effects.
4. How should the carbon fee program interact with state programs that address carbon pollution?
Those are, indeed, difficult questions. So let’s take a look at each of them in turn:
1) How big should the carbon tax be? Economists have long argued that a carbon tax can be an elegant way to tackle climate change. If you tax oil, coal, and natural gas and make them more expensive, then people and companies will either use fewer fossil fuels or seek alternatives. Markets will adjust to the new price.
But there’s plenty of dispute over what the appropriate price on carbon emissions should be. For that, you need to figure out how much damage heat-trapping greenhouse gases are actually causing — and figure out how highly to value future generations. The federal government currently pegs the “social cost of carbon” at $21 per ton. Other economists have concluded that the price should be up to 12 times as much.
2) How quickly does the tax need to rise to curtail emissions? A tax that rises each year should, in theory, drive down emissions. But a lot could depend on how quickly the tax actually rises.
Here’s one example: Sebastian Rausch and John M. Reilly of the MIT Global Change Institute recently put forward a proposal for a $20-per-ton carbon tax that would rise 4 percent each year, starting in 2013. (The funds would be used to offset taxes elsewhere.) Here’s what their model predicts would happen to U.S. greenhouse-gas emissions:
Under this proposal, U.S. greenhouse gas emissions do start declining quite a bit (this is the green line), with a relatively small impact on the U.S. economy. But by 2030, emission levels stall, even though the carbon tax keeps rising by 4 percent each year. The United States wouldn’t get anywhere near the 80 percent cut by 2050 that the White House has envisioned.
It’s possible the MIT model is too pessimistic or wrong. It’s also possible that deeper emissions cuts might require a carbon tax that rises even more sharply. But a higher tax could also prove more costly to the economy unless it’s offset properly. So there’s a delicate trade-off here.
3) What’s the best way to use the carbon tax revenue? A carbon fee usually gets criticized for hurting poorer Americans the most—they spend the biggest slice of their income on gasoline and other energy-intensive products, after all. But Rausch and Reilly found that a lot of the distributional effects depend on how Congress rebates the revenue, as shown in the chart below:
The green line shows how different income groups would be affected in 2015 if the carbon tax was used to fend off cuts to social welfare programs like Medicaid. Lower-income Americans would benefit significantly, while wealthier Americans would take a small hit.
By contrast, the red and blue lines show the effects if revenue from the carbon tax was used to cut the corporate tax or personal income tax—in those cases, higher-income Americans would come out ahead.
If, however, carbon tax revenue was used to cut payroll taxes—that’s the black line—then the welfare effects in 2015 are more or less neutral.
On the flip side, some experts like Mark Muro of Brookings have argued that a portion of the revenue raised by a carbon tax should be used to fund public clean-energy R&D. The country won’t wean itself off oil solely because carbon gets taxed. We’ll also need public-transit alternatives, or electric-vehicle infrastructure, or futuristic new hydrogen cars. And in many cases, Muro argues, the government may have to help bankroll this infrastructure.
4) How does the carbon tax interact with the states? California is currently operating its own comprehensive program to cut greenhouse-gas emissions 80 percent by 2050. And 10 states in the Northeast have a small cap-and-trade program for electric utilities. Should these states somehow get “credit” for moving early on global warming? And what’s the best way to do that under a carbon-tax system?
In any case, these are all difficult questions. Those who want to join in on this debate can submit comments to the lawmakers at cutcarbon@mail.house.gov. The comment period ends April 21.