
News + Media
Research universities and nongovernmental organizations have an important role to play in helping countries reach their goals
Valerie Karplus and Michael Davidson | MIT Joint Program
After two weeks of negotiations, the Paris climate talks that ended on December 12 delivered the foundations of a post-2020 climate regime.
To advance climate change mitigation efforts, the new agreement incorporates national targets for greenhouse gas (GHG) emissions for 2025/2030, a new five-year cycle to establish subsequent targets, a reporting and review placeholder, and official stocktaking two years prior to those submissions to compare global progress against long-term goals.
In Paris, 189 of 195 participating countries pledged action in the form of intended nationally determined contributions, or INDCs. These pledges will be assessed in 2018 to encourage countries, where possible, to increase the level of ambition.
The review mechanism agreed on in Paris is a crucial first step. The new climate regime has also been lauded for its transparency provisions, which will be essential to establishing trust in the review process.
Implementing the pledge review process laid out in Paris will not be easy, but it is necessary to have a chance of ratcheting up efforts over time to meet the agreement’s ultimate goal of limiting global temperature rise to well below 2 degrees Celsius.
It is here that research universities and nongovernmental organizations (NGOs) will have an important role to play.
A transparent review process
A functioning review process will require open and collaborative participation of signatory countries but should not rely solely on an expanded global bureaucracy. The vast majority of third-party analysis on countries’ energy and climate policies comes from academic and nongovernmental organizations, which should be strengthened following Paris.
Official reporting and review processes have existed since the framework convention in 1992. Over time, they have evolved to include periodic communications and highly structured reviews – differentiated by developing and developed countries – performed by a small set of accredited UN experts and other countries themselves. Paris strengthened these requirements by requiring, among other items, all major economies to submit biennial reports and a unified review of all countries' submissions.
Many parts of the current agreement are placeholders for detailed provisions to be decided over the coming years. We argue that in the new architecture of bottom-up pledges, the international community has an increased responsibility to assess levels of effort and abilities to scale up successful approaches.
Because of the complexity of nations' institutions, these mechanisms should be designed to enhance both the quality and impact of research outside formal UN processes. In particular, to both assess and support country pledges with an aim to accelerating global emissions reductions, we need significantly more transparency on pledges and policies and a flexible review process that can respond to concerns from academia.
Measurable and model-able pledges allow research communities to arrive separately at their own assessments of countries’ relative levels of effort and progress toward national commitments.
For example, using a countrywide energy-economic model of China, our collaborative team of researchers from Tsinghua University and MIT estimated annual reductions of over four Gigatons CO2 per year in 2030 in a scenario consistent with that country’s Paris pledge compared to a no-policy case. This reduction would equal approximately three times Japan’s CO2 emissions in 2014. More importantly, this work helped policymakers in and outside of China understand how policies then under consideration could help the country reach peak CO2 emissions in 2030, with the help of a CO2 price.
Many other groups arrived independently at estimates of available CO2 emissions reductions from the Chinese economy. It is exercises like these that offer transparency, credibility and – perhaps most importantly – an opportunity to probe and enhance a shared understanding of the implications of national commitments that remain at arm’s length from the political arena.
Beyond pledges
Assessments of pledge progress reports would naturally be more convincing if accompanied by a suite of policy actions and planned changes in existing institutions and processes to facilitate implementation.
To reinforce pledges, countries are called on in the agreement to submit “information necessary to track progress.” More concretely, they should be asked to compile a list of implementing directives, challenges faced and proposed pathways, given that most governments are establishing domestic policies prior to announcing them on the global stage in future climate talks.
For instance, the US’ Clean Power Plan, a crucial policy in the absence of nationwide climate legislation, will face significant court challenges.
Reporting requirements should explicitly recognize these domestic policy constraints, allowing the scientific and modeling community to consider their implications and investigate, as needed, alternative policy pathways.
Data challenges
A transparent, arm’s-length review process will also help to generate internationally credible assessments of GHG abatement efforts in developing countries, where accounting challenges are significant.
As a case in point, China, which targets a 60%-65% reduction in its CO2 intensity in 2030, relative to 2005 levels, is well known for its challenges in reporting accurate data. The country recently revised upward how much coal it has been burning every year by as much as 17%.
Indeed, data revisions will occur, particularly in developing countries that are in the process of establishing data collection systems.
The biennial reporting requirement agreed to in Paris can provide a regular avenue to incorporate revisions. The research community can also help by incorporating revisions into models and assessing implications for meeting emissions goals.
Negotiators further agreed that national commitments should be communicated to “facilitate clarity, transparency and understanding.” This should extend to the range of assumptions and calculation methodologies.
For example, conventions for calculating the nonfossil share of primary energy differs among countries and agencies. China uses the coal-equivalent method, which equates electricity use to the coal use it displaces, while the International Energy Agency employs the direct-equivalent method, which yields smaller percentages for a given level of deployment.
Another benefit of engaging research communities is scaled-up technical analysis and support, while added redundancy allows for multiple independent assessments of progress. These assessments can help identify and laud when countries exceed their goals, encourage upward revisions by expanding successful programs, identify reasons for slow progress and inform technological and policy solutions.
Peer-reviewed pledges
Transparency is critical, and redundancy will further limit – although not entirely avoid – any efforts to undermine the integrity of the process.
Building on previous pledging systems, an important change in Paris was to create a common technical expert review, composed of a limited number of accredited experts with special training. These experts could play an important role in knowledge assessment and synthesis of the country analysis outside experts deliver. In addition, the review should be constructed to allow for official clarification of methodologies such as those raised above.
Stocktaking processes will also be decided over the coming years, and galvanizing a wide range of civil society researchers will likewise be critical to success. The range of emissions gap reports in advance of Paris, a case in point, illuminated important assumptions for future trends such as expected levels of future efforts, or ratcheting.
The requirement to take stock every five years has the potential to become a focal point for wide-ranging studies on long-term goals.
Engaging the broader community
The Paris agreement institutionalizes a periodic review of pledges such that countries are expected to come back both with increased commitments and progress reports. This process will be absolutely critical if we are to come close to achieving the most ambitious climate change mitigation goals embodied in the Paris agreement.
Engaging the broader research community in the review process is our best hope for generating credible estimates of how we are doing as a planet. A critical part of this will be equipping researchers in developing countries to participate as equal partners in this assessment effort.
Up to now, pledges have been the key measure of a climate regime’s success. But only if it devotes just as much ambition to review as it does to pledges can the new global climate regime truly deliver.
Authors
Valerie J Karplus, Assistant Professor of Global Economics and Management, MIT Sloan School of Management
Michael Davidson, PhD Candidate in engineering systems , Massachusetts Institute of Technology
The Conversation is a collaboration between editors and academics to provide informed news analysis and commentary that’s free to read and republish.
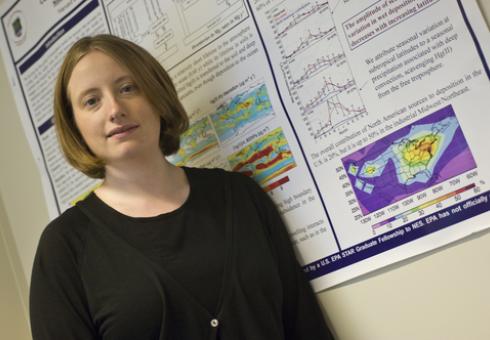
Photo: Valerie Karplus takes questions at a panel discussion held by the MIT Club of Paris during the COP21 talks. (Source: Emily Dahl/MIT Energy Initiative)

MIT events throughout climate talks underscore Institute's global perspectives and partnerships
How China's international and domestic policy positions reinforce each other
Posted by Michael Davidson and Valerie Karplus on Dec 11, 2015
From the Paris Climate Negotiations
National goal-setting—an expected key outcome from the Paris climate talks currently underway—is a common fixture of policy-making in China and many other countries. Collectively, the current pledges still show significant gaps toward meeting long-term climate goals. Nevertheless, they represent an important increase in scope and ambition over those pledged in advance of the 2009 Copenhagen summit, and those established earlier under the Kyoto Protocol. There is great importance in—and a growing consensus around—enhancing these previous rounds of commitments through a pledge-and-review institution, which if designed properly can also mobilize domestic constituencies even across a wide range of political systems. As China and other countries begin to consider their next steps, we explain here the interaction of international and domestic policy-making in setting climate action targets in China.
China’s Increasingly Stringent International Commitments
China in particular stands out for its evolution over this period as it has taken on increasingly stringent international commitments in tandem with massive climate and energy programs at home. Looking at its domestic constituencies—including extremely powerful fossil fuel and local government interests that are net losers under a carbon control program without compensation—this transition over the span of less than a decade is striking.
Economic advantages as a major clean energy equipment exporter, international pressure as China transitioned to the world’s largest emitter, and pervasive concerns over air pollution have helped persuade central policymakers. In turn, we find that central figures have created and used international pledges (outer – Wai) as a lever to push for and prioritize domestic action (inner – Nei). To understand how this works, we describe how underneath China’s unitary central government lies a complex policy-making hierarchy, which reinforces actions and realigns interest groups to further a transition toward low-carbon energy sources.
Climate Targets in Three Flavors
China’s energy-related climate targets come in three flavors: 1) intensity-based targets with respect to economic growth; 2) shares of energy supply, i.e., minimum non-fossil proportion of primary energy; and, most recently, 3) a CO2 peaking year (though not peaking amount). A sudden increase in energy-intensive production over 2002-2005 created concerns of energy insecurity and led to the establishment of the first flavor, energy intensity “binding targets” (约æŸæ€§ç›®æ ‡) in the 11th Five-Year-Plan (2006-2010). A medium-term target of the second flavor, to achieve a non-fossil energy share in primary energy1 of 15% by 2020, was established in a 2007 energy strategy document together with a range of other expansion goals meant more as guidelines than targets. At that point in time, there was no discussion of peaking emissions on the horizon.
In studies of China’s governance system—especially the target-setting process—it is well-known that more targets are given than are expected to be followed. Thus, prioritizing central directives is a crucial exercise for provincial governments, the typical implementing institutions (state-owned enterprises are the other). These decisions are made based on different assessments of importance, but binding targets established in five-year-plans as well as internationalized commitments are given high weight.
In 2010, on the heels of the Copenhagen climate talks, it was announced that several provinces were behind schedule in reducing energy intensity. Premier Wen Jiabao, who had delivered China’s international climate commitment, became the central domestic figure rounding up the laggards. China’s pledge in preparation for those talks also raised the non-fossil energy target out of obscurity and enshrined a CO2 intensity objective, which joined energy as a binding target in the 12th Five-Year-Plan released two years later.
Over the next five years, China’s central agencies set forth a number of climate and energy policies, ranging from traditional mandatory approaches such as scaled-up industrial energy efficiency mandates to newer economic incentives such as standardized electricity tariffs for all renewable energies and carbon cap-and-trade pilots. These had the support of the important National Leading Group on Climate Change, Energy Conservation and Emissions Reduction, which in turn has cited responsibility to meet internationalized commitments.
Inside China’s Policymaking
A simplified sketch of the importance of highly publicized goals, using the recent round of electricity reform as an example, is instructive. In 2013, central party leaders set guiding principles on a new round of market reforms through small leading groups—which have a long history of directing central policy—chaired by President Xi Jinping, and last year set timetables for specific reforms. Language—e.g., related to the role of the market—was translated into a high-level State Council energy strategy document in 2014 and ultimately a blueprint for electricity sector reorganization released this year. Finally, agencies such as the National Development and Reform Commission (NDRC) and the National Energy Administration (NEA) have visited localities to emphasize the importance of the specific reform measures, and have established policy and implementing measures (e.g., to improve renewable energy utilization). At each step, the crucial link with central goals was preserved, ensuring that the drafting—typically not done by State Council staff—helped unambiguously establish priorities.
International and Domestic Policy Reinforcing Each Other
China’s Paris commitment expands this process by incorporating the three flavors of targets and helping shape future domestic actions. To increase non-fossil energy share, China promised to implement “green power dispatch” in a joint US-China announcement made prior to this year’s UN talks. And a CO2 peaking year of no later than 2030 will provide much-needed urgency to establishing rules and accountability for the upcoming national cap-and-trade system.
This policy process has clear implications for the importance of a robust pledge-and-review institution. China’s commitments—including a US$3.1 bn climate fund for developing countries—helped build momentum for Paris. The UN process can also help ratchet up and improve implementation of commitments by ensuring there are frequent reviews of existing pledges and continued opportunities for new ones. This will not only prompt central leaders to make bolder commitments but also provide ammunition for those seeking further domestic reforms to achieve them.
1.Importantly, China’s calculation of primary energy deviates from international conventions. See Lewis et al 2015.
Michael Davidson is a PhD candidate in engineering systems at the Massachusetts Institute of Technology (MIT), and a research assistant in the Joint Program on the Science and Policy of Global Change. Dr. Valerie Karplus, a ChinaFAQs expert, is an Assistant Professor in the Global Economics and Management Group at the MIT Sloan School of Management, and a Faculty Affiliate of the MIT Joint Program on the Science and Policy of Global Change.
ChinaFAQs is a project facilitated by the World Resources Institute that provides insight into critical questions about Chinese policy and action on energy and climate change. The ChinaFAQs network is comprised of U.S.-based experts, including researchers at U.S. universities and government laboratories, independent scholars, and other professionals.
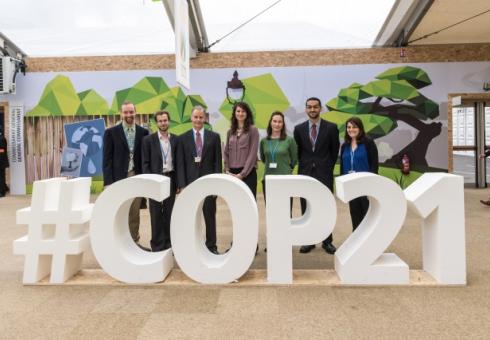
Photo: China and U.S. pavilions at COP21. The U.S. and China announced their international commitments together in advance of the Paris talks. (Photo by Michael Davidson)

Faculty and students from the Program in Atmospheres, Oceans and Climate visited our nation's capital to build relationships with policymakers on both sides of the aisle.
Cassie Martin | Oceans at MIT
Navigating the current U.S. political climate can be tricky business, especially when it comes to science policy. With Congress divided more than ever on numerous important issues, including climate change, it’s important for legislators to have access to experts and the best available scientific research. Earlier this year, graduate students and faculty from the Department of Earth, Atmospheric and Planetary Sciences’ Program in Atmospheres, Oceans, and Climate traveled to our nation’s capital on a mission to bring them the latest atmospheric and geoscience research — and build relationships with policymakers on both sides of the aisle.
Dan Cziczo, an associate professor of atmospheric chemistry, met with senators from Massachusetts and Maryland during Weather Day on the Hill hosted by the University Corporation for Atmospheric Research (UCAR). “It was fun and a great learning experience for me,” he said. “We were there to make people aware of what we're doing with the funding we receive and how it’s not just abstract science but impacts everyday life.”
Cziczo not only cleared up common misconceptions such as where weather information comes from, he also discussed the science behind increases in temperature and severe storms. But it’s not enough to just give legislators a quick primer on the latest science. Researchers also have to make it relatable. For Cziczo, that meant tying the changes in temperature and storms to agriculture. “Policymakers put a great emphasis on their particular constituents and their state’s economic growth. Bringing [the science] back to a global picture is I think really helpful,” he said.
It’s not just faculty that are offering their scientific services, MIT students are also getting in on the action through various organizations, including the American Meteorological Society (AMS). “Working with students is great,” said Ya’el Seid-Green, an AMS policy program associate. “We think one of the best things we can be doing is getting to people early in their career and helping them think about how their work fits into society and fits into policymaking.”
Much like Cziczo, MIT graduate students Daniel Gilford and Dan Rothenberg met with various congressional aides through AMS earlier this year during Weather, Water, and Climate Day to offer themselves as a resource. “As scientists, it's tempting to sit at our desks all day and do research and never get out and talk with people face to face about what we're doing, what we think is important, and how what we're doing relates to other people,” said Gilford, who is also a student coordinator for MIT’s Joint Program on the Science and Policy of Global Change. “We’re used to writing scientific papers, but it's more challenging to communicate science well to people who don't have a strong background in science or your specific research area.”
Another item on their agenda was to emphasize the importance of funding geoscience research — an all-encompassing term that refers to the scientific fields dealing with planet Earth. Sequestration of the federal budget in 2013 tightened the belt around scientific funding sources across all fields, and researchers are still feeling the effects. Now it’s more important than ever for policymakers to know where the money they allocate for scientific research goes and how that research benefits their constituents. For Gilford and Rothenberg, meeting with congressional aides was an opportunity to put faces on the dollar signs without advocating for specific legislation or federal agencies — an AMS policy.
“When you pour money into geosciences to support students like myself, we can go on to do a lot of different research that's important for stakeholders and improves the research community,” Gilford said. When he isn’t building relationships with congressional offices, Gilford studies the impact of atmospheric radiation on hurricanes. His research, which has important implications for people living along the East Coast and the Gulf of Mexico, opened up some great conversations about climate and extreme weather. “I was pleasantly surprised and impressed at the level of engagement. I didn’t get the feeling we were unwanted at any point. Everybody understood we were there to help, we weren’t there as some sort of lobbying team.”
Fostering conversations of climate change, a politically fraught subject on Capitol Hill, requires a delicate touch. Some policymakers are more open to discussions than others, and in some instances even uttering the phrase can shut down dialogues. Through his work with AMS and the MIT Science Policy Initiative, Rothenberg has developed indirect approaches to opening up the climate change conversation, such as using buzzwords and reframing his research. “I can spin it a lot of ways, like how air pollution affects clouds, or building models of clouds to predict thunderstorms,” said Rothenberg, a physicist who studies clouds in the context of climate. “Any time you can link it back to economics and public safety, you can usually hook in and get a good conversation going.”
Rothenberg currently resides in Massachusetts, but he originally hails from Kentucky and has developed a good relationship with Republican Senator Mitch McConnell’s office over the years. Although currently embattled with the Obama Administration over the Environmental Protection Agency's Clean Power Plan, McConnell still focuses on science and environmental issues at home in Kentucky. In the past, he has helped sponsor bipartisan legislation to boost federal science funding such as the original America COMPETES act, which aims to improve the competitiveness of the United States through investing in innovative science, technology, and education.
But legislators need access to sound science to affect sound science policy like the COMPETES act — something that isn’t always available. Throughout the years, Rothenberg has happily answered questions from McConnell’s office, but not all of them are related to atmospheric science. The problem, Rothenberg says, is the lack of scientists willing to meet with policymakers. “The biggest barrier [to building science policy relationships] is the mismatch of interests,” he said.
Scientists’ reluctance to build relationships with politicians stems from a fear of harming their reputation for being objective and unbiased. Although that is a legitimate concern, there are ways to make connections and maintain moral and scientific integrity. “If your goal is to develop a relationship with offices as a person they can come to for the scientifically validated information they need — if you’re just willing to do that, it’s not murky politically,” said Rothenberg. “I’ve never met an office that didn’t love science. It’s very bipartisan. In terms of wanting the facts so they can do the best job they can, no politician is going to turn down scientists.”
Congressional visit days through AMS and the MIT Science Policy Initiative are an invaluable scientific resource for policymakers. But they also provide researchers with new perspectives on the inner workings of the policy process. “It's really easy to get cynical about science and politics, but if you go up there and meet the people who work on the hill, you'll learn they are incredibly smart, dedicated, and hardworking,” said Ya’el Seid-Green. “It gives you a better appreciation for the hard work that goes into making policy. It breeds mutual respect between the science and policy communities.”
Photo: MIT atmospheric chemist Dan Cziczo meets with Senator Elizabeth Warren (D-Mass.) during a Congressional Visit Day (Courtesy of Dan Cziczo)
MIT Water Summit presents insights, innovations and solutions to protect our world’s most abundant natural resource
Kelsey Damrad | Civil and Environmental Engineering
Amid a changing climate, population growth, rapid development, and pervasive urbanization, an unprecedented threat to the world’s food and water supply is more apparent than ever before. In fact, it is predicted that 70 percent more food will be needed by 2050 and the demand for water will triple.
"To date, we’ve met the food and water challenge to a significant extent through technology, as exemplified in the 'green revolution,' but there are still significant problems to solve. We’re optimistic that MIT will have a major role in meeting the world’s challenges around food and water supply," John Lienhard, director of the Abdul Latif Jameel World Water and Food Security Lab (J-WAFS) at MIT, said in the opening remarks at the third annual MIT Water Summit held Nov. 13-14 on campus.
"Workshops such as this are critical to raise awareness and build momentum towards solving the grand water challenges of our world," said Elfatih Eltahir, associate department head and a professor in the Department of Civil and Environmental Engineering (CEE). "The Water Summit was a wonderful opportunity for open and transparent discussions that helped in reaching better definitions of water problems and paved the way for new and innovative solutions."
An MIT Water Club team — comprised of MIT graduate students Reetik Kumar Sahu, Anjuli Jain Figueroa, Alexis Fischer, Matthew Willner, Brendan Smith, and Isadora Cruxen — organized this year’s Water Summit into three conversation panels: Interpret, Innovate, andImplement. The team brought together more than 200 members of the MIT and non-MIT communities to discuss the role of climate change in global water challenges.
Over the course of two days, several representatives from academia, government, and industry were invited to present.
Adaptation to climate change means embracing uncertainty
"The biggest risk to our water systems is our social norms," Col. John Henderson of the U.S. Army Corps of Engineers said. "We, as a society, may not be adapting fast enough." Of course, the path leading to full adaptation to climate change is far from clear, he added.
The Interpret panel included Henderson, Camille Touton of the U. S. Department of the Interior, Scott Doney of the Woods Hole Oceanographic Institute (WHOI), Manoj Fenelon of the Aspen Institute, and MIT graduate student Jordon Hemingway as moderator.
One major hindrance that Fenelon said prevents climate adaptation is the way the problem is framed. "How do you explain the challenge in a way that causes people to realize it is bigger than their individual interests?" he asked.
To emphasize, Touton said that 50 percent of the world is in severe drought — a negative impact of climate change that many do not directly experience. Using open water data to visualize the impact of drought and climate change on water resources, she said, is one aspect of the problem that her department investigates and reports to the public.
"The world is teeming with answers, but are we asking the right questions?" Fenelon added. Perspectives unrelated to science — such as considering water as a right rather than a luxury — may result in interesting and efficient approaches to the challenge.
Leveraging branding, for instance, was one such approach explored by the panel. "I would be interested to see brands engage in civil work," Fenelon said. "Consumers would be buying not just a brand, but a movement."
In agreement, Doney added it’s not the destination that matters, but rather how quickly society manages to get there. When it comes to climate change and the global water supply, the rate of change heavily impacts the natural ecosystems.
However, the panelists agreed, the key to truly engaging open interest is to pitch the science behind climate change in a way that attracts stakeholders and, more importantly, the general public.
The future is about radical transparency
In their remarks on how technological innovations and research have led to more resilient water systems, the Innovate panelists — Noel Bakhtian, lead strategic coordinator on Energy-Water Nexus activities for the U.S. Department of Energy; Marcus Quigley, founder of OptiRTC; Anarug Bajpayee, co-founder and CEO of Gradiant Corporation; Mark Ellison, U.S. affiliate of IDE Technologies; and MIT graduate student and panel moderator Divya Panchanathan — offered a hopeful, yet guarded, perspective.
For Quigley, the world needs a future of “radical transparency” of data. With an open explanation of the reality of water, he postulated that this approach will transform the manner in which we act and develop regulations around water management.
"We need to be creative with data science and make water information more meaningful for the public to digest," he said.
Noting society’s hesitancy to trust new innovations in the water sector, Bajpayee suggested some of the challenge may also lie with people’s misconception of the value of water.
"People think water is free when it’s not," he said. "Something is paying for it. Explaining this openly and clearly may help people appreciate how important it is to conserve energy and water."
When it comes down to it, Quigley continued, our perception on what we think the world should look like is irrelevant. The gateway to water management is about delivering the outcomes people expect, and furthermore educating them on why they should expect those outcomes from a political perspective.
The panelists contended that the world would benefit from focusing more on a transparent understanding of the projected outcome and less on what society portrays as an ideal world.
One way to achieve this may be for water businesses to expand their reach beyond one idea and emphasize an entire market or specialized sector.
"The most successful companies are those who have evolved along the way," Bajpayee said. "Water entrepreneurs should build businesses around an entire platform, not just one innovation."
Climate change is no longer about belief, but fact
To close the Water Summit on the second day, keynote speaker Curt Spalding of the U.S. Environment Protection Agency (EPA) for New England introduced the Implement panel with a discussion on the hard evidence and implications of climate change.
Spalding said 70 percent of the population accepts that climate change is happening, and, because of this, progression is being made to both mitigate and adapt to the reality. "Adaptation is a priority and is integrated into every decision made by the EPA," he said. However, it’s not always as high a priority as it should be for others, he added.
Spalding emphasized the need to communicate complex data to the implementers for real movement to be made in the fight against climate change. This notion was further explored in the panel, moderated by MIT graduate student Alice Alpert, and comprised of Edgar Westerhof of ARCADIS U.S. Inc., Stephen Estes-Smargiassi of the Massachusetts Water Resources Authority, Dennis Carlberg of Boston University, and Larry Susskind, the Ford Professor of Urban and Environmental Planning at MIT.
According to Susskind, the hindrance to true innovation in policy implementation is mainly the lack of collaboration between leaders and the public. "No decision is ever going to be completely correct, so we will have to collaboratively adapt as things evolve," he said.
Estes-Smargiassi agreed, and added that it is equally important to embrace any potential opportunity to build resiliency — even if the timing or innovation is not perfect.
"Each opportunity that we fail to grasp, puts us further behind," he said. "Let’s figure out which steps we should take now to continue to move ahead later." Particularly, participatory planning is a crucial part of resiliency planning; otherwise, he explained, there may not be buy-in.
Corporation mitigation efforts and sponsoring of events, such as the international Sustainable Innovation Forum 2015 in Paris, has a powerful effect in changing the public image of what’s being done today. While concrete conclusions may not necessarily be drawn from efforts such as these, confidence is built for the long-term. And this, the panelists agreed, is effective in the process of managing water in a time of a changing climate.
"The MIT community is deeply motivated to contribute," Lienhard said. "Our students and faculty are bringing their insight, innovation, and technical excellence to bear on the challenge of water management."
Sponsors for this year's Water Summit included Arcadis, Association of Student Activities, MIT's Department of Urban Studies and Planning, CEE, the Coop at MIT, Desalitech, Environmental Policy and Planning Group, Gradiant Corporation, J-WAFS, MIT International Science and Technology Initiatives, MIT Brazil, the WHOI, Pepsico, and WRI Brazil.u
Photo: The 2015 MIT Water Summit team organizers (Courtesy of MIT Water Club)
Professors Henry Jacoby and Valerie Karplus (MIT Sloan School of Management) and their collaborator, professor Xiliang Zhang (Tsinghua University; MIT-Tsinghua China Energy & Climate Project) speak at this event. Addressing an audience of COP21 attendees, MIT alumni, current students, and others, they discussed how China’s actions coming out of COP21 could help shape the future global energy system.
Includes commentary by John Reilly and climate change calculator based on methodology co-developed by Adam Schlosser