News + Media

via E&E News
Amanda Peterka | E&E reporter
Bioenergy production would boom and spur steep reductions in greenhouse gas emissions if a global price is slapped on carbon, Massachusetts Institute of Technology researchers say in a report released today.
Examining bioenergy production under a $15-per-metric-ton carbon price that would rise steadily to $59 in 2050, researchers found production hitting 150 exajoules by 2050 -- compared with below 50 exajoules without a carbon price.
Global greenhouse gas emissions would plunge 16 percent under that scenario, the report says, cautioning that the carbon price studied doesn't take into account land-use changes. Taking into account emissions from land-use changes, including deforestation, it says greenhouse gas reduction would be nearly 60 percent from the no-carbon-price baseline.
"The study is one of the most in-depth evaluations to date of how bioenergy might fit into a low-carbon future," MIT said in a release. "The research team developed a cutting-edge modeling tool covering a comprehensive range of bioenergy pathways."
The MIT Joint Program on the Science and Policy of Global Change says its study goal was to see how bioenergy would compete with other low-greenhouse-gas options on a level playing field.
The researchers used the Economic Projection and Policy Analysis model to create both the carbon price scenarios and assumptions about economic, productivity and population growth without a carbon price. The model examined seven first-generation biofuel crops and two cellulosic biofuel conversion technologies -- bioelectricity and heat.
The model also accounted for international trade, ethanol blending limits, changes in land and production costs, and existing policies such as the federal renewable fuel standard, among other factors.
"Biofuels are only one channel for bioenergy," said Niven Winchester, an environmental energy economist at MIT. "If you want to study how land can be used to meet our energy needs, you have to think of all the different ways to use what grows on that land -- including food, feed and fuel."
The carbon price scenario resulted in efficiency improvements and energy use reductions, the report says. Electricity consumption in 2050 dropped 19 percent, while there was 73 percent less electricity from coal.
With a carbon price in the MIT model, bioenergy use rose from 8.5 exajoules in 2015 to 152.4 exajoules in 2050 -- or about a quarter of global energy needs.
The model found that corn ethanol would be produced in the United States until 2025, when it would become uneconomical.
After 2025, cellulosic ethanol would become the primary form of bioenergy; by 2020, cellulosic ethanol would account for about 57 percent of the globe's total bioenergy consumption.
Increased energy prices under a carbon price would make grasses -- one of the main inputs for cellulosic ethanol -- more attractive, while cellulosic producers would face lower land costs than other biofuel producers, according to the report. Rising electricity prices would also increase the revenue that cellulosic producers could receive from producing electricity as a co-product.
Africa and Brazil would become the largest bioenergy producers in a world where cellulosic ethanol is the main form of bioenergy, the MIT study found.
"Africa can become a key player in supplying global energy, if agricultural expertise can be transferred to this region," Winchester said. "It has the right climate and a large amount of land, but also the potential for deforestation if policy safeguards aren't in place."
The growth in cellulosic ethanol assumes that production costs fall over the next 35 years and that ethanol-blending constraints disappear by 2030 partly through the use of more flex-fuel cars.
MIT found that pricing greenhouse gas emissions from bioenergy land-use changes significantly increases the amount of greenhouse emission reductions that occur as a result of bioenergy expansion.
Pricing land use changes would prompt a global reforestation of 800 million hectares between 2010 and 2050, according to the study. In 2050, cumulative carbon-dioxide-equivalent emissions would be 37,381 million metric tons if land-use changes were priced, compared to 74,140 million metric tons if they were not.
"The report concludes that changes spurred by the carbon price, including bioenergy production, could cut greenhouse gas emissions by more than half, with a catch -- to achieve the cut, the carbon price must cover emissions from changing land use," MIT said. "Without this safeguard, deforestation becomes a major concern as forests are cleared to make way for farmland."

 |
||
|
|
Photo: Dara Entekhabi, courtesy of Len Rubenstein, MIT Spectrum |
by Audrey Resutek | MIT Joint Program on the Science and Policy of Global Change
On January 29, 2015, a Delta II rocket launched from Vandenberg Air Force Base will carry the SMAP Observatory, the first satellite designed exclusively to monitor soil moisture, into orbit. Once there, the satellite will make a map of the Earth’s soil moisture every three days—creating a measurement with the potential to dramatically improve weather forecasts and predictions of climate change.
It’s been a long journey to get to this point, as Prof. Dara Entekhabi, the science team leader of the NASA mission and a researcher at the Joint Program on the Science and Policy of Global Change, can attest. SMAP, which stands for Soil Moisture Active Passive, was first conceived in 1999. Over the last 15 years, Entekhabi has led a team of researchers at MIT and other universities, the NASA Jet Propulsion Laboratory, and the NASA Goddard Space Flight Center working on the satellite.
“The team has stuck together,” notes Entekhabi, who holds a joint appointment in MIT’s Department of Civil and Environmental Engineering and the Department of Earth, Atmospheric and Planetary Sciences. “It’s almost the same people as when we started working on SMAP.”
Once SMAP is in orbit it will measure moisture in the first five centimeters of the soil, using two instruments—active microwave radar and a passive microwave radiometer. The data transmitted back to Earth will represent a huge leap forward for scientists studying how the Earth works.
Unconventional Data
Entekhabi has spent his career learning about the Earth through collecting data, and the information collected by the SMAP Observatory will fill a major gap in our understanding.
“I was always into data and the environment, and reconstructing old records,” says Entekhabi. “I eventually became interested in creating new sources of data—unconventional data. Which is how I became involved with SMAP.”
SMAP is the first NASA mission dedicated to studying soil moisture and freeze/thaw data, which indicates the start and end of the growing season. Because of this, current records are spotty at best, and are based mostly on data from sparse ground stations and readings from satellites primarily designed for other uses.
 |
|
|
Photo: Artist's rendering of the SMAP spacecraft, courtesy of NASA/JPL. |
The mission is somewhat unusual, Entekhabi says, because the long development period gave the mission team time to cultivate a community of early data adopters, who have already developed applications for the data. The information produced by SMAP will be tailored to fit these users’ needs—allowing them to immediately put the data to use for forecasting and research.
“This is a path-breaking approach for NASA, because the applications are woven into the science of the mission. So, it’s broad basic research, as well as application,” says Entekhabi.
There is an impressive range of uses for soil moisture data. These include the obvious, like improving weather and climate forecasting; estimating agricultural productivity; tracking droughts, floods and landslides; to the less obvious, such as providing early warnings of famine in areas dependent on rain-fed crops; determining soil hardness on military transportation routes, and forecasting the density of the lower atmosphere, which determines how much lift an airplane has.
The lack of information about soil moisture is also a problem for basic Earth science research, because soil moisture links the three major cycles of the Earth system—the water, energy, and carbon cycles—together. Without accurate soil moisture data it’s nearly impossible to accurately trace the movement of water through these three systems.
“These are basically three gears that are locked together,” Entekhabi says. “If we don’t get this right in models, because we don’t know what the linkage is, it’s a problem. Measuring soil moisture is important because it’s the pivot that links these three gears.”
 |
||
|
|
Photo: SMAP lowered into place, courtesy of NASA/JPL-Caltech. |
|
Understanding soil moisture will likely greatly improve the accuracy of weather forecasts at a fraction of the cost of other measures, like beefing up computing power to support higher resolution weather models. It will also improve how models estimate how climate change will affect precipitation, which, up until now, has been notoriously difficult to pin down.
“All the models agree on global temperature; you can’t get that wrong,” Entekhabi says. “But what’s going to happen with regional water availability, regional precipitation, the models don’t even agree in sign—some of them are positive, some of them are negative—let alone magnitude.”
Taking Extreme Weather’s Fingerprint
Entekhabi’s work on the water cycle and soil moisture spans decades, starting with his doctoral work at MIT, where he worked to improve how climate models account for land surface moisture. He joined MIT’s faculty in 1991 and has been involved with the Joint Program since its creation in the early 1990s.
“A major question in the field today is what is climate change going to do to the water cycle?” Entekhabi says. “The real challenge is predicting the future of water availability at a regional scale.“
To address this issue, Entekhabi worked with the Joint Program to create a new way of predicting how climate change will affect the frequency and severity of extreme precipitation. The method takes advantage of the fact that climate models do a good job of simulating the large-scale atmospheric events that lead to extreme precipitation, even though they’re bad at predicting the precipitation itself. The method bypasses climate models’ built-in precipitation parameterizations, and instead looks for the large-scale conditions that have been associated with extreme weather events in the past.
“What we’re doing is basically fingerprinting,” Entekhabi says. “We use the historical record to find a fingerprint, or pattern of what’s going on in the large-scale climate that causes extreme weather.
The technique, called an “analogue” method because it does not directly simulate precipitation within the model, gives more accurate reproductions of past extreme weather events than climate models alone. Once the patterns associated with extreme weather—either very wet or very dry—are identified, the next step is to look at future changes in these patterns in a climate model.
Entekhabi is currently working to identify these patterns across several regions. In one example, he studied over 100 years of precipitation data for the region around Mumbai, where the monsoon season can cause devastating floods in densely populated areas. The monsoons that caused the worst flooding left a distinct atmospheric fingerprint, he found.
“The fingerprint of the monsoon is much larger than the local flooding in Mumbai,” Entekhabi says. “The circulation patterns extends all the way to the Arabian Sea and the coast of East Africa. Basically a long arc of vapor from the Arabian Gulf gets blocked, and it just sits there and rains a lot.”
The method can be applied to any event in any region, as long as it is associated with changes in large-scale atmospheric conditions. Working with Dr. Adam Schlosser, a senior research scientist and assistant director for science research at the Joint Program, Entekhabi is currently applying the analogue method to West Africa, a region that relies on rain-fed agriculture for most of its food. Most of the rain in the region falls during a three-month rainy season in the summer, and what happens in the rainy season can make or break the area’s food supplies.
“Models will always be uncertain once you start looking into the future,” Entekhabi says. “SMAP is one way we’re trying to improve the quality of models—by looking at how the water and carbon cycles fit together. The analogue approach is another way of attacking the challenge of regional water availability from an entirely different angle.”
For now, Entekhabi is turning his attention skyward. In the Fall, Entekhabi traveled to Southern California, where SMAP was being loaded into a rocket at the Jet Propulsion Laboratory. He’ll remain there through the spring, while SMAP is being calibrated.
“It’s been a long trek,” Entekhabi says. “But every single screw on SMAP has been reviewed and reviewed and reviewed. Right now there’s no more testing, no more touching the satellite. There’s no looking back now.”

Graduate Student and Rwandan native Jimmy Gasore and Research Scientist Kat Potter are working to establish Africa’s first climate observatory. In this video, they talk with MIT’s Earth, Atmospheric and Planetary Sciences group about the project.
Ronald G. Prinn, the TEPCO Professor of Atmospheric Chemistry, Director of the Center for Global Change Science and Codirector of the Joint Program on Science and Policy of Global Change at MIT, talks with MIT’s Earth, Atmospheric and Planetary Sciences group about the Rwandan Climate Observatory project.
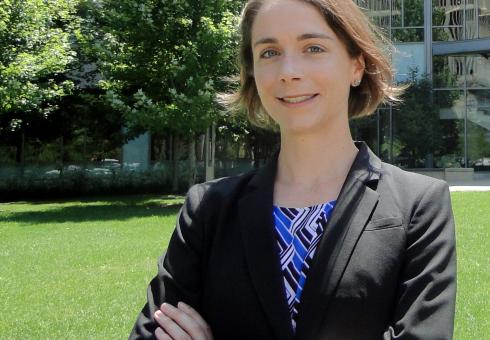
The announcement of a joint pledge to cut emissions between the world's two largest carbon emitters: the United States and China, made global headlines when it was announced in November. In this interview, Valerie Karplus, an asssistant professor in MIT's Sloan School of Managment, discusses the details of the deal.
by Jesse Jenkins | The Energy Collective
Jesse Jenkins: Even before world leaders descended on Lima, Peru this week for United Nations-sponsored climate negotiations, climate diplomacy made global headlines with the joint announcement of a partnership between the world's two largest carbon emitters: the United States and China.
The joint pledge to cut greenhouse gas emissions and collaborate on clean energy technology development has been hailed as a potential sea change in the tone and substance of international climate mitigation efforts.
To dig in to the details of this U.S.-China climate partnership, I caught up this week with Valerie Karplus, an assistant professor at the Massachusetts Institute of Technology's Sloan School of Management and Director of the Tsinghua-MIT China Energy Program.
An expert on both American and Chinese energy and climate policy, Prof. Karplus and I explored what the climate deal means for domestic energy policy in each nation, chatted about the major drivers of emissions growth in China, and considered implications of the new emissions pledges for international climate negotiations.