
News + Media
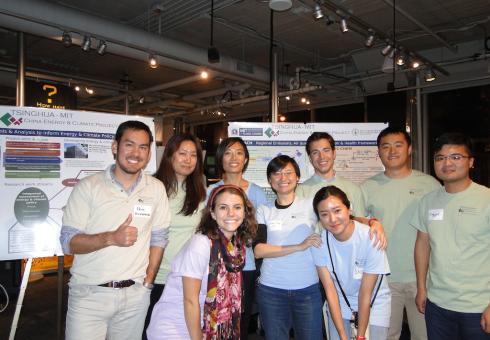
The CECP Team presented our ongoing work at the annual MIT Energy Night, which was held Friday, October 16, 2015, at the MIT Museum. This public event showcases energy-related activities at MIT, including presentations from research laboratories, student groups, and early stage energy startups based on technologies developed at MIT. The CECP team interacted with a broad audience of scholars, policy makers, business professionals, and students interested in learning more about our ongoing work. For more information, please see http://mitenergynight.org/.
Photos from the event:


Institute-wide initiative aims to address environmental issues at all scales, from campuswide to worldwide.
by David L. Chandler | MIT News
John E. Fernandez, a professor of building technology in the Department of Architecture, has been named as the new director of MIT’s Environmental Solutions Initiative (ESI), a campuswide initiative launched in 2014. Fernandez succeeds Susan Solomon, the Ellen Swallow Richards Professor in the Department of Earth, Atmospheric and Planetary Sciences, who has served as the Initiative’s founding director.
“I’m honored to be taking over from such an eminent scientist,” says Fernandez, who has served on the MIT faculty for 16 years. “It’s really humbling to hear her talk about her work and be given the opportunity to extend the reach of the ESI.”
Fernandez’s appointment was announced today in a letter to the MIT community from Provost Martin Schmidt and Vice President for Research Maria Zuber.
“Professor Fernandez approaches this role as a world expert on high-performance, sustainable building materials, as a leading scholar on the resources and infrastructure of cities — home to more than half the human population — and as a practicing architect who has led the design for more than 2.5 million square feet of new construction in cities from Washington, D.C., New York, and Los Angeles to Jakarta, Tokyo, and Shanghai,” Schmidt and Zuber wrote. “A member of our faculty since 1999, he founded and directs the Urban Metabolism Group, a highly multidisciplinary research group that studies how intelligent design and technology can reduce the resource intensity of cities.”
Since its founding in May of last year, ESI has awarded nine seed grants for research projects, on efforts that include promoting sustainable consumption in cities, improving methods for safe mining on land and at sea, and improving air quality and plans to mitigate global climate change. Such highly multidisciplinary projects can be difficult to fund through traditional channels.
“I’m delighted to be passing the reins to such a well-qualified and distinguished scholar,” Solomon says. “John Fernandez has a deep understanding of MIT’s strengths across a very diverse suite of environmental challenges, and he brings a clear commitment to excellence and breadth. I’ll be looking forward to seeing him take ESI to the next level.”
Fernandez says ESI’s broad scope is illustrated by the very different backgrounds of its first two directors. “I’m very optimistic about the vision for ESI,” he says: If this initiative can embrace leaders from fields as different as atmospheric science, architecture, and building technology, “It speaks to the breadth of MIT, and the commitment to the ESI.”
Fernandez’s research looks at the environmental consequences of societal activities — which tend to be concentrated in the world’s cities. “Decisions that architects and planners make can have huge ramifications, because the built environment accounts for the consumption of enormous quantities of energy and materials,” he says. Such environmental consequences, he says, “should be integral to a designer’s thinking process.”
“The Intergovernmental Panel on Climate Change has shown the built environment to be one of the major contributors to global emissions,” Fernandez says. “What is less well known is that a majority of raw materials extracted and processed are used in the construction and operation of buildings, roads and other large-scale infrastructure. For that reason, much of my work has been focused on understanding the environmental benefits of resource-efficient buildings and cities.”
Since more than half of the world’s population now lives in urban areas, Fernandez says, he has focused on systems involved in the functioning of modern cities, from buildings and transportation to the delivery of food, water, sanitation services, and goods — and the resource intensities associated with these services. The research outcomes from his group contribute to a field known as “urban metabolism,” because it treats the city as an interconnected whole, rather than focusing on individual components or economic sectors. This is best done through a multidisciplinary approach.
In the work of the ESI, Fernandez says, “many solutions will require multiple perspectives” — which underscores the importance of communication and collaboration among disciplines, and an understanding of different modes for tackling problems through science, engineering, design, and policy.
Fernandez sums up his vision for the Initiative by considering the three components of its name: environmental, solutions, and initiative.
On the environment, he says, “the priority is to progress beyond the discussion of the uncertainties about climate change, to delve deeper into research that tells us more about the consequences of climate change, and to do research in targeted ways that will tell us about the kinds of risks we are facing.” Researchers tackling those issues should be provided with resources to do their work, but also to help them in communicating “a very simple but unequivocal message that the science of the climate is well-established and the most conclusive it can be, and is telling us very dire things that we should really pay attention to.”
The second priority, Fernandez says, lies in solutions. It’s essential, he says, “to propose pathways toward mitigation and adaptation in every aspect of society, with regard to every important human activity, enlisting engineers, scientists, architects, economists, political scientists, and others, and with regard to all regions of the world.” For example, hundreds of millions of people live in coastal cities, which face significant threats from sea-level rise. Designers need to converge on integrated solutions with other disciplines to enlist multiple systems for adapting these cities, he says “so that we’re not approaching this in a siloed way.”
The initiative part of the ESI’s name, Fernandez says, “is the part that I hope will bear important short-term and local results for MIT. I believe this initiative has the critical responsibility to initiate action across diverse communities at MIT.”
The ESI, Fernandez adds, should involve all sectors of our community — undergraduate and graduate students, postdocs, faculty, researchers, and staff. “We will be working to initiate a great many actions for the environment, both local and global,” Fernandez says. “Some will be very targeted and modest, and others extraordinarily ambitious, broad and sweeping.”
One example of a way in which Fernandez hopes to implement this agenda, he says, is in funding student projects, including some that might relate directly to residential life: “Support for even very modest but very immediate grassroots projects, where it’s right there in front of you, is something I’m very keen to launch as soon as possible,” he says.
Study finds pledges by top greenhouse gas emitters leaves little room for others; urges greater R&D.
by Jennifer Chu | MIT News Office
Over two weeks in December, delegates from virtually every country in the world will gather in Paris for the 21st annual United Nations Climate Change Conference. Their ambitious goal: to hammer out a binding international agreement on climate action.
In advance of the conference, organizers have requested that countries submit Intended Nationally Determined Contributions — pledges to reduce greenhouse gas emissions, by an amount that should be “fair and ambitious,” in order to limit global warming to no more than 2 degrees Celsius above pre-industrial levels.
Now a new study by researchers at MIT and the Center for International Climate and Environmental Research in Oslo, Norway, has found that pledges by the three largest emitters — the United States, the European Union, and China — leave very little room for the rest of the world to emit.
Based on the pledges submitted, the U.S. plans to reduce emissions by 28 percent by 2025, and 83 percent by 2050, while the EU will work toward reductions of 40 percent by 2030, and 80 percent by 2050. China has not pledged a reduction, but has indicated that its emissions will peak by 2030; China also aims to improve its energy efficiency by 60 to 65 percent.
Despite these substantial commitments, the researchers found that the rest of the world’s nations would be forced to adopt per capita emissions 7 to 14 times lower than the EU, U.S., or China, by 2030, in order to keep global temperatures from rising higher than 2 C.
“The challenge of this problem is, we have about 7 billion people on the planet, and about 1 billion of us live pretty well,” says Susan Solomon, the Ellen Swallow Richards Professor of Atmospheric Chemistry and Climate Science at MIT. “The other 6 billion are struggling to develop, and if they develop using carbon as we did, the planet is going to get quite hot. And hot is, of course, just the beginning of the story in terms of what climate change actually means.”
Solomon and her colleagues have published their results in the journal Environmental Research Letters.
What’s fair?
While countries were asked to demonstrate that their pledges were fair and ambitious, conference organizers provided no framework with which to make such an assessment.
In the new study, the MIT and Norwegian scientists gauged the fairness and ambition of the top three emitters’ pledges using a “cumulative emissions” approach developed by the Fifth Assessment Report of the Intergovernmental Panel on Climate Change.
The cumulative emissions approach finds that a best estimate of 3.7 trillion tons of carbon dioxide can be emitted globally before temperatures rise 2 C above pre-industrial levels. Given the amount of carbon dioxide emitted thus far, and accounting for other greenhouse gases, land-use change, and other factors, the remaining amount is about 1 trillion tons — about 30 years’ worth of current emissions.
How to fairly allocate the remaining allowable emissions among the world’s nations is a complex and contentious issue. Solomon and her colleagues examined two scenarios for fairly reducing emissions by the EU, U.S., and China: an equity approach, which divides the global quota of emissions among all nations based on population; and an inertia approach, which divides the quota based on the current shares of global emissions.
Based on their calculations, they found all three emitters’ pledges fall short of fair: The U.S. and EU pledges may be considered in line with keeping global warming at 2 C only under the inertia scenario, in which the high emitters continue to emit based on their current shares. If, however, both were to adopt an equity scenario, they would have to pledge significantly more emissions reductions, to account for their relatively small share of the world’s population.
China’s pledge deviates significantly from both scenarios, as both would require the country to immediately begin drastic reductions. Instead, China has pledged to begin reducing its emissions in 2030, so as to improve the quality of living for its millions of citizens now living under the poverty line.
“The environment we ask for”
In sum, Solomon and her colleagues conclude that even if the three largest emitters fulfill their pledges, they would “lock the world into a higher long-term temperature increase” of around 3 C.
“People don’t realize that 2 degrees Celsius is a big change,” Solomon says. For instance, she points to the summer of 2003, in which an unprecedented hot summer killed more than 10,000 people throughout Europe.
“That summer was about 2 degrees Celsius hotter than an average European summer,” Solomon says. “By 2050, every summer in Europe will probably be 2 degrees hotter than average, if we keep going the way we’re going right now. Three degrees, in my opinion, is a really frightening change.”
To stave off additional warming, Solomon says countries will need to significantly ramp up efforts to decarbonize. In the short term, she says, international climate talks must integrate discussions on research and development, to spur technological innovation.
“We have to decarbonize the energy system via research and development, changes in technologies and policies, and we need to encourage those to happen,” Solomon says. “We’ll get the environment we ask for. History has proven time and again that public engagement is essential in making anything change on this planet.”
Solar panel system wins $10,000 prize for technology that makes energy and water more accessible in the developing world
Vicki Ekstrom | Laur Fisher | MIT Climate CoLab
Solar panel system wins $10,000 prize for technology that makes energy and water more accessible in the developing world
An MIT initiative is using the global crowd to help solve climate change. And with the United Nations’ climate agreement anticipated to fall short of the 2 degree Celsius carbon emissions target, it’s never been a more critical time to take this approach.
MIT’s Climate CoLab initiative is a growing community of 50,000 people from around the world who work together online through a series of interrelated contests focused on different aspects of the climate change problem. Yesterday, MIT hosted the Crowds and Climate conference, where the Climate CoLab awarded its 2015 contest winners.
Eden Full from the non-profit SunSaluter won the $10,000 Grand Prize for its technology that makes energy and water more accessible in the developing world. Their product uses gravity and water to rotate a solar panel throughout the day, generating 30 percent more electricity than a standard panel and four liters of clean drinking water each 24-hour period. The rotator is cheaper than motorized solar trackers and has already achieved success: there are already 130 SunSaluters in 16 countries.
"This prize is especially important now," said Full, founder of the project. "We just decided that SunSaluter will become fully volunteer-led, supported by our non-profit and corporate partners. This funding will go toward making that possible."
In addition, two proposals received honorable mention awards:
- A national campaign on energy conservation and renewable energy in Indian schools that is working towards building a network of energy ambassadors. The campaign already has support from the Indian government, and is well on its way to fostering a more environmentally-aware generation of Indians.
- A mechanism for internalizing marine emissions that combines charging a levy on emissions from international maritime shipping, with a fuel levy on fuel consumption by domestic shipping
These proposals were selected by Robert Armstrong, director of the MIT Energy Initiative; Jason Jay, director of the MIT Sloan Sustainability Initiative; John Reilly, co-director of the Joint Program on the Science and Policy of Global Change.
The grand prize and honorable mention awards were selected from the 34 winners of the 24 contests run on the Climate CoLab in 2015. The winners are a diverse group of non-profits, entrepreneurs, scholars and climate experts, students, business people, and concerned citizens looking to confront the climate challenge, who hail from 11 countries.
The Climate CoLab also announced the winner of its United States Climate Action Plan contest, which sought regional solutions to climate change. Unlike the other contests, which target specific sub-problems that contribute to climate change, this contest asked participants to take different actions and combine them to form a regional strategy.
The winner for the United States Climate Action Plan contest suggested a pathway to engineer cities so that they are built for livability, sustainability, resiliency, energy-efficiency and affordability.
An important addition to this round of contests is a tool — and a team of climate modelers — to help people to evaluate the impact their ideas will have on global emissions. The public can also combine regional plans to form global strategies. The Global Climate Action Plan contest is still open and accepting submissions until Oct. 17th.
All the winners were recognized at the Crowds and Climate conference, held this week alongside MIT’s Solve conference. Crowds and Climate brought together leaders from businesses, non-profit organizations, governments, and communities around the world to advance an online global problem-solving effort to more effectively tackle climate change. This bottom-up approach enables large communities of people to work together to shift business practices, influence policy makers, and reshape public attitudes and behavior on climate change.
“Our goal is to open up the elite conference rooms and meeting halls where climate strategies are developed today and bring that discussion into an online forum where anyone with a good idea can contribute,” says Professor Thomas Malone, director of the Center for Collective Intelligence at the MIT Sloan School of Management and principal investigator for the Climate CoLab project.
“We are very proud of this year’s winners, and we see this as just the beginning of new ways to use our global collective intelligence to tackle important societal problems like climate change.”
The Joint Program is a cosponsor of the Crowds & Climate conference.
Photo: Grand prize and honorable mention award winners, with Professor Thomas Malone (center) and Laur Fisher (second from right) of the MIT Climate CoLab (Photo by Justin Saglio)

MIT researchers explain how technical analysis can avoid potential conflict.
CAMBRIDGE, Mass. — On the Blue Nile in Ethiopia, construction is underway on a public works project of gigantic physical proportions and exquisite political delicacy. The Grand Ethiopian Renaissance Dam, now about halfway finished, amounts to a test: With water becoming precious enough to be the stuff of war, can nations find ways to share it?
So far, so good. The project is moving toward completion, and a recent joint declaration of principles by the leaders of Egypt, Ethiopia and Sudan pledges cooperation and no “significant” downstream harm. That is critical, given that the dam will control nearly two-thirds of the water on which Egypt depends. But for the cooperation to be meaningful, these three countries will need serious technical analysis. Poor assessment of such matters as the variability of annual rainfall or minimum flows required to maintain downstream water quality could undermine a decent agreement, leading to conflict of unpredictable intensity.
That’s because the flow of the Nile is climatic roulette. It experiences periods of plentiful water and periods of extended drought, and it always has: Remember the story (in both the Bible and the Quran) of seven years of plenty, and then seven lean years? But now the stakes are much higher: Egypt’s population is 90 million, and growing. That country’s Aswan High Dam, downstream from the Ethiopian dam, helps to moderate these fluctuations, but a second large dam and its reservoir higher upriver are going to complicate things.
Egypt now receives virtually all its water from the Nile — about 60 billion cubic meters a year, slightly above the amount provided for in its treaty agreement with Sudan. That amounts to the withdrawal of 700 cubic meters per capita per year. Compare that with California, which annually withdraws about 1,400 cubic meters per capita from multiple sources, including 30 percent of the Colorado River’s annual flow, and you understand just how scarce and precious the Nile’s water is to Egypt’s welfare.
California depends heavily on Lake Powell and Lake Mead, the reservoirs behind dams on the Colorado River, which together store slightly more than three years’ worth of that river’s total flow. The new dam in Ethiopia will have an even larger storage capacity than that of Powell and Mead combined, but still amounts to just 1.5 years of the flow of the Blue Nile alone. Adding in the very large reservoir behind Egypt’s Aswan High Dam gives a storage of about 1.75 years of the total flow of the Nile. It’s not a wide margin of safety for a long drought — as Californians will attest.
The monsoon rains in Ethiopia that will feed the new dam come mainly during just three months, so by storing that water, the new dam will moderate and smooth out the flow of the Blue Nile, the 900-mile-long headstream of the Nile itself. It will also generate huge amounts of electricity, the sale of which could finance much-needed development in Ethiopia — except that transmission lines to export the power are not yet being built.
Just as California has used stored water to become an agricultural powerhouse, Sudan will benefit by using the more stable flow of water from the new dam to raise its agricultural productivity. This will allow Sudan, which sits between Ethiopia and Egypt, to finally employ its full treaty allotment of river water, which in turn will reduce what is available to Egypt.
It’s clear that a cooperative agreement among Ethiopia, Sudan and Egypt is needed to avoid conflict and downstream harm. This includes agreement on what amounts to “significant” harm, given that, in the past, Egypt has been willing to go to war to protect its water.
All three countries stand to benefit if they work together. The dam’s huge storage capacity could help both Sudan and Egypt during drought years. And if Egypt were to agree to buy the power that the new dam will generate (and to build the transmission lines to connect to it, perhaps with international help), then Ethiopia will benefit economically from stored water that has to flow downstream eventually.
Here is where the technical issues will be critical. Last November, the Abdul Latif Jameel World Water and Food Security Lab at M.I.T. convened experts on Nile Basin water resources. They pointed out that management of a river system with multiple dams required sophisticated joint management with a shared knowledge base and scientific modeling framework. The hard negotiations ahead to achieve detailed agreements on such things as reservoir operation policy, power trading, dam safety and irrigation practices will require that foreign policy and water experts from each of the three countries have a shared understanding of the technical issues and a willingness to compromise.
In May 2015, the three countries engaged technical consultants to assist with these problems, but that arrangement has since collapsed over disagreements about project management. It behooves the international community to help, through support of regional efforts like the Nile Basin Initiative, to build scientific and engineering coordination and knowledge among the three countries, provide impartial expertise, set up a management system and perhaps offer a process to resolve disputes.
The world needs to get good at sharing water, and right away. The alternative is frequent regional conflicts of unknowable proportions.
John H. Lienhard V is a professor at M.I.T. and director of the Abdul Latif Jameel World Water and Food Security Lab. Kenneth M. Strzepek is a research scientist at the M.I.T. Joint Program on the Science and Policy of Global Change.

In ChinaFAQs column, Valerie Karplus assesses joint statement on emissions reductions
The latest Obama-Xi announcement sends a strong message: the two nations are acting fast to enable a global low carbon transition. Friday’s joint announcement is an unprecedented step by the world’s #1 and #2 emitters to commit, at the highest levels, to a strong set of domestic policies and to reinforce global mechanisms that will help to engage peers ahead of the upcoming landmark climate change negotiations in Paris.
Pricing Carbon
Xi has committed China to launching a national emissions trading system for CO2 in 2017. An emissions trading system will directly constrain a large share of China’s CO2 emissions and, by putting a price on emissions, encourage reductions where they cost least. This is impressive in that China is pledging to reduce emissions at a time when its per-capita income is less than one-fifth of the U.S. and its economy faces headwinds. It recognizes the long-term benefits of action now—for local air quality, global climate, and its own long-term leadership in delivering innovative solutions that all nations will eventually need.
While China is not the first to establish an emissions trading system, China’s is likely to be the largest when it comes online in 2017. While the European Union has built an emissions trading system over the past two decades, the U.S. has so far not been successful in adopting a national system for greenhouse gases. In 2009 the Waxman-Markey Bill, which would have established an emissions trading system in the U.S., failed to pass Congress, leaving the U.S. to rely on a piecemeal approach that largely repurposed existing regulations, such as vehicle fuel economy standards and power plant emissions limits established under the Clean Air Act, to mandate CO2 emissions reduction. Indeed, these measures formed the cornerstone of the U.S. domestic action pledged on Friday, and they will have impact. However, an emissions trading system that could deliver the same reductions at lower aggregate cost has so far proven politically unpalatable. China’s latest move could prompt a rethink on emissions trading in the U.S.
Linking Global and Local Action
Along with a strong portfolio of coordinated domestic actions, Xi and Obama made progress on defining the architecture of a global climate agreement. The two leaders have agreed on the need for an enhanced system that monitors domestic action through reporting and review of progress, recognizing that some developing nations will still need time to put these capacities into place. Both sides also recognized the need to increase ambition over time. This is essential because even with all present contributions, the global emissions trajectory is not expected to bend down anytime soon. Recognizing that this will likely not be fully resolved in Paris, setting in place a timeline for assessing and revisiting commitments going forward will go a long way towards ensuring that the goal Xi and Obama reaffirmed at the outset of their remarks—deep reductions in GHG emissions that will markedly limit global temperature rise—does not slip off the radar.
Beyond generating momentum ahead of Paris, U.S.-China joint action will have far-reaching consequences at home when it comes to enabling a low carbon transition. Although many insiders anticipated that an emissions trading system in China would be established, efforts to codify this effort in a new Climate Change Law were moving more slowly—this high-level pledge will redouble the pressure. Beyond emissions trading, China has also pledged to promote “green dispatch” in the electricity sector, which will prioritize lower emitting plants. In China, generators are powerful interests entitled to supply a “fair share” of annual generation—now, their “fair share” will need to reflect environmental impact more strongly and directly.
Leading on Climate and Development
Perhaps the greatest promise of the latest announcement by China and the U.S. lies in its invitation to all parties to increase ambition, if not before Paris then as soon as possible as part of ongoing negotiations. On the eve of Paris, the world is poised to miss the 2 degree target—by a large margin. Stronger action will be needed by developed and developing countries alike. By committing to limit CO2 emissions, China has shown that domestic action on climate change does not need to undermine long-term development goals. In recent years, it has developed the domestic capability to assess—through research, modeling, and real-world experimentation—the advantages and disadvantages of various instruments for limiting fossil energy use and CO2 emissions. The results suggest that some opportunities, such as industrial energy efficiency and new energy development, can support cleaner air, better operational performance, and—in the case of, say, solar energy—open opportunities as a leading global provider of clean technology. Every developing country will have its unique set of opportunities. The architecture emerging on the road to Paris is shaping up in a way that will accommodate these differences, allowing the countries that are poised to grow the fastest over the next several decades to find ways to power this growth with clean, affordable, low carbon energy sources. Greater action from the developed world will also be essential. Ideally, the steps Xi and Obama have taken last week will inspire a broad-based, cooperative effort to deliver more than promised that carries both local and global benefits.
Dr. Valerie Karplus is a ChinaFAQs Expert at the Massachusetts Institute of Technology (MIT). She is an Assistant Professor in the Global Economics and Management Group at the MIT Sloan School of Management and Director of the China Energy and Climate Project (CECP) at MIT.
ChinaFAQs is a project facilitated by the World Resources Institute that provides insight into critical questions about Chinese policy and action on energy and climate change. The ChinaFAQs network is comprised of U.S.-based experts, including researchers at U.S. universities and government laboratories, independent scholars, and other professionals.
Photo Credit: U.S. Embassy the Hague via Flickr Creative Commons License